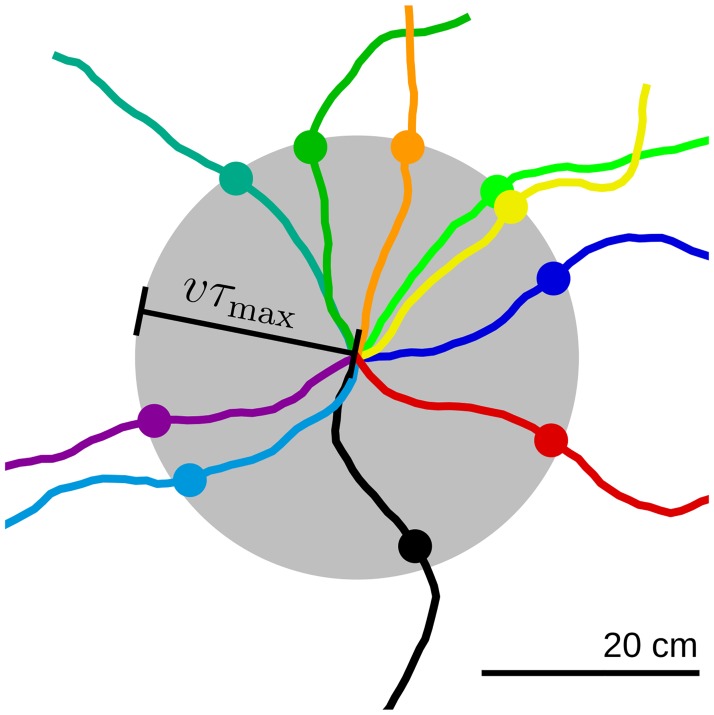
Fig 2. Example virtual-rat trajectories.
Colored lines denote example virtual-rat trajectories obtained by integrating Eq 11 starting at the center of the gray disk. Filled dots indicate the position of the virtual rat at time τmax = 5τL = 0.8 s. Note that the trajectories are smooth within time stretches shorter than τmax. Parameter values: v = 0.25 m/s, θσ = 0.7. The disk radius is vτmax = 20 cm.

