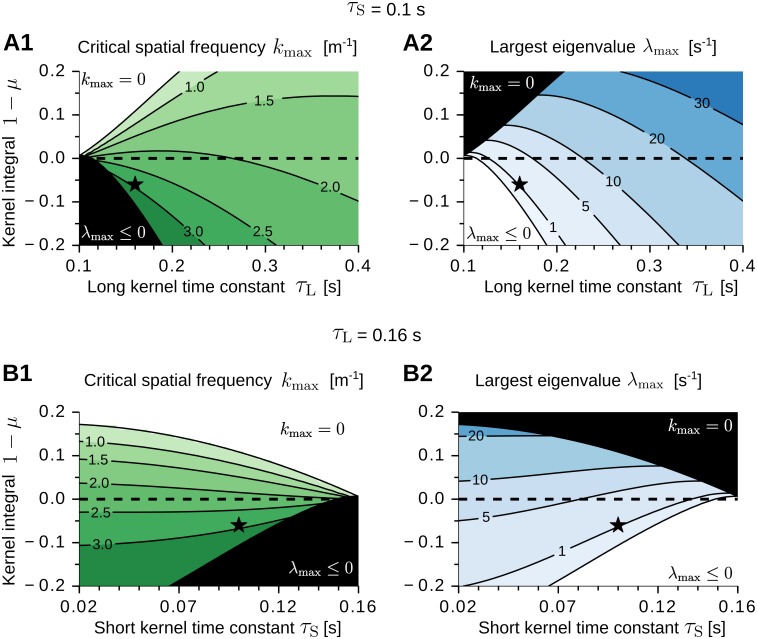
Fig 4. Impact of the adaptation kernel on grid-pattern formation.
(A1-A2) Critical spatial frequency kmax (A1) and largest eigenvalue λmax (A2) as a function of the kernel integral 1 − μ and the long kernel time constant τL. The short time constant is τS = 0.1 s. The black lines are iso-levels (see annotated values). Regions enclosed by two adjacent iso-lines are colored uniformly (darker colors denote larger values). Within the black region in A1 we obtain λmax ≤ 0 s−1 (see white region in A2). Within the black region in A2 we obtain kmax = 0 m−1 (see white region in A1). The dashed horizontal line indicates zero-integral kernels. The star denotes the parameter values τS = 0.1 s, τL = 0.16 s, μ = 1.06 of the kernel in Fig 1. (B1-B2) Same as in A but varying the short kernel time constant τS. The long time constant is τL = 0.16 s. The eigenvalue spectrum is estimated from Eq 32. Further parameter values: σ = 6.25 cm, rav = 0.4 s−1, Wtot = 1 s, ρ = 900 m−2, L = 1 m, v = 0.25 m/s, a = 1.1 s−1.

