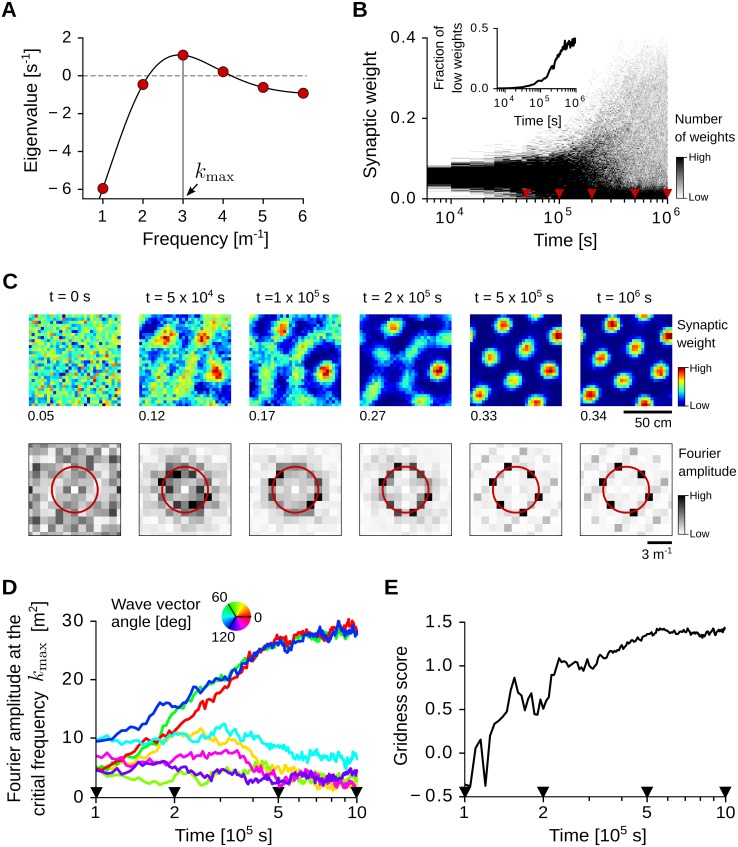
Fig 5. Grid-pattern formation with spatially-regular inputs.
(A) Eigenvalue spectrum λ(k) of the averaged weight dynamics (Eq 32). The black solid line shows the continuous spectrum in the limit of infinite-size environments; the red dots show the discrete eigenvalues for a square arena of side length L = 1 m with periodic boundaries. The horizontal dashed line separates positive and negative eigenvalues. The vertical gray line indicates the critical spatial frequency kmax = 3 m−1. The eigenvalue at frequency k = 0 is not shown. Parameter values: τS = 0.1 s, τL = 0.16 s, σ = 6.25 cm. (B) Time-resolved distribution of N = 900 synaptic weights updated according to the STDP rule in Eqs 3–6. Red triangles indicate the time points shown in C. Inset: fraction of weights close to the lower saturation bound (wi < 5 ⋅ 10−3). (C) Top row: evolution of the synaptic weights over time. Weights are sorted according to the two-dimensional position of the corresponding input receptive-field centers. Note that each panel has a different color scale (maximum weight at the bottom-left corner, see B for distributions). Bottom row: Fourier amplitude of the synaptic weights at the top row. The red circle indicates the frequency kmax = 3 m−1 of the largest eigenvalue (see panel A). (D) Time evolution of weights' Fourier amplitudes for wave vectors k at the critical frequency |k| = kmax. Wave vector angles (color coded) are relative to the largest mode at the end of the simulation (t = 106 s). The black triangles indicate time points in C. (E) Gridness score of the weight pattern over time. The gridness score quantifies the degree of triangular periodicity. See Sec Numerical simulations for further details and parameter values.

