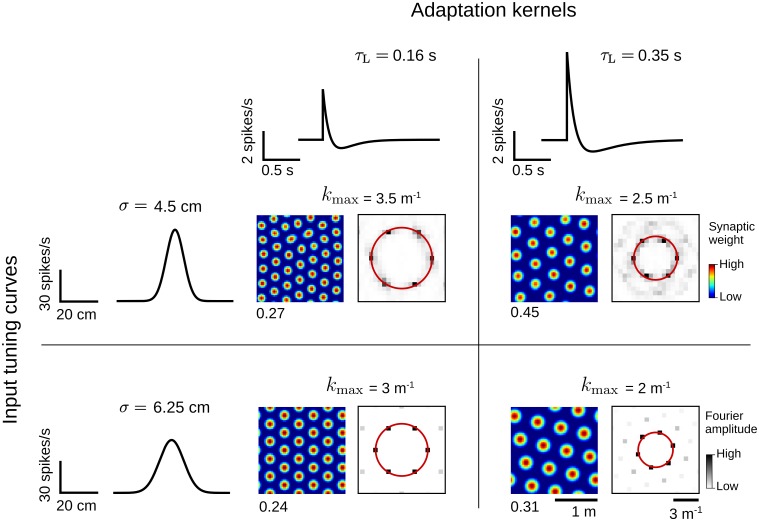
Fig 7. Spatial scale of the grid patterns.
Example grid patterns obtained with different adaptation kernels K (Eq 2, top row) and different input tuning curves (Eq 9, left-most column). For each choice of the functions K and , the synaptic weights (left) and their corresponding Fourier spectra (right) at the end of the simulation are shown (t = 106 s). The synaptic-weight maps have different color scales (maximal values at the bottom-left corner). The red circles indicate the spatial frequency kmax of the weight patterns. Synaptic weights were obtained by simulating the average weight dynamics in Eq 16. Note that we used a larger enclosure (L = 2 m) as compared to the one in Figs 5 and 6 (L = 1 m). See Sec Numerical simulations for further details and parameter values.

