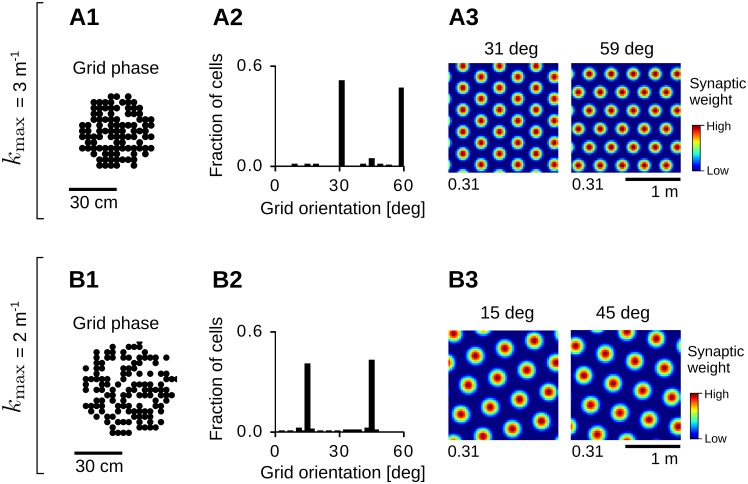
Fig 8. Geometric properties of the grid patterns.
(A) Distribution of grid spatial phases (A1) and grid orientations (A2) for patterns at frequency kmax = 3 m−1 in an arena of side-length L = 2 m (σ = 6.25 cm, τL = 0.16 s; see also Fig 7, bottom-left panel). Distributions were obtained from the average weight dynamics in Eq 16 for 200 random initializations of the synaptic weights (t = 106 s). Only patterns with gridness scores larger than 0.5 were considered (197/200). Panel A3 shows example weight patterns for the two most common orientations in A2 (maximal values at the bottom-left corner). (B) Same as in A but for patterns at spatial frequency kmax = 2 m−1 in an arena of side-length L = 2 m (σ = 6.25 cm, τL = 0.35 s; see also Fig 7, bottom-right panel). A fraction of 182/200 grids had a gridness score larger than 0.5. See Sec Numerical simulations for further details and parameter values.

