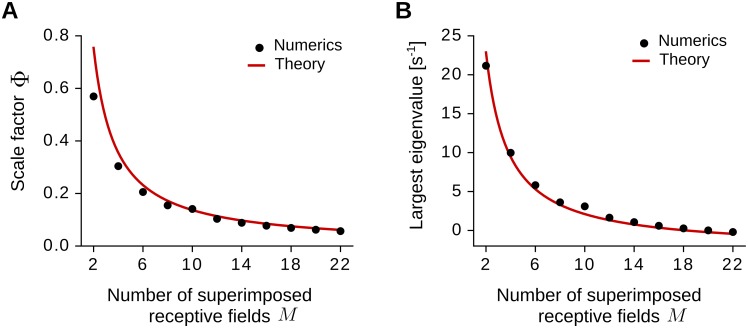
Fig 10. Scale factor Φ and largest eigenvalue λmax for spatially-irregular inputs.
(A) The scale factor Φ for M > 1 superimposed fields (Eq 70). The black dots are obtained by estimating the power spectrum at frequency |k| = 1 m−1 for 3600 input realizations. The red line is the theoretical curve in Eq 82. (B) The largest eigenvalue λmax as a function of the number of superimposed fields M. The black dots are obtained by computing the eigenvalues of the correlation matrix Cij − aδij for N = 3600 inputs, where δij is the Kronecker delta (Eq 21). The red line is obtained from Eqs 71 and 82. Note that, according to Eq 71, the largest eigenvalue is always at the critical frequency kmax = 3 m−1 for any value of M. Parameter values as in Fig 9 (see Sec Numerical simulations).

