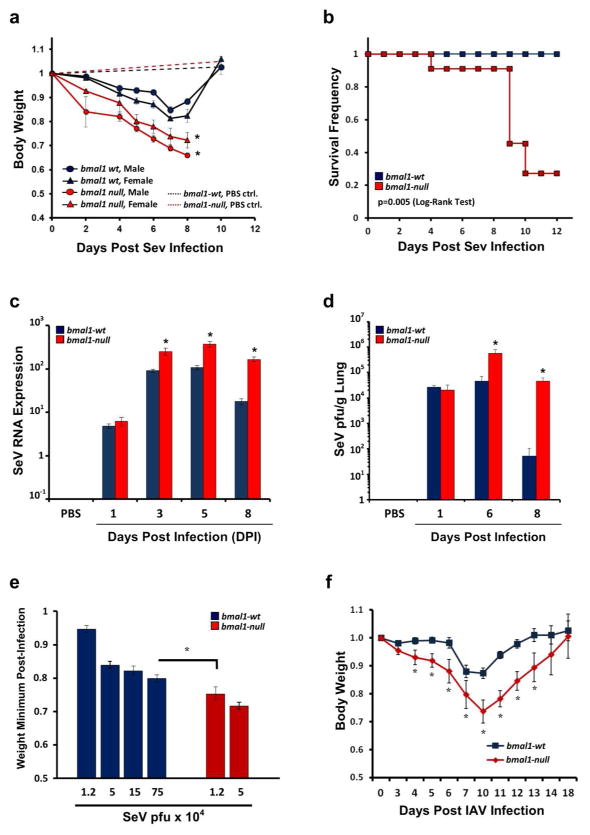
Figure 1.
Deletion of clock gene bmal1 renders mice more vulnerable to viral bronchiolitis. (a) Animal weights (normalized to starting weight) after infection with 1.5x10⁵ pfu SeV. Each point represents the mean weight ± SE. Blue circles: SeV-infected bmal1-wt males (n=19). Blue triangles: SeV-infected bmal1-wt females (n=12). Red circles: SeV-infected bmal1−/− males (n=12). Red triangles: SeV-infected bmal1−/− females (n=12). Blue dashed line: Sham (PBS inoculated) bmal1-wt males (n=5). Red dashed line: Sham (PBS inoculated) bmal1−/− males (n=4). SeV infection data were pooled from 4 independent experiments. (b) Survival after infection with 1.5x10⁵ pfu SeV. Blue symbols: bmal1-wt (n=15). Red symbols: bmal1−/− littermates (n=11). Data is pooled from 2 independent experiments, and each group is composed of near-equal proportions of male and female animals. Note that sham (PBS) inoculation did not produce animal mortality in either genotype (data not shown). Statistical significance by Log-Rank Test is depicted. (c) Viral RNA expression as measured by qPCR at various times after intranasal infection with SeV (1.5x10⁵ pfu). Each bar represents the mean SeV gene expression normalized to tbp ± SE. Blue bars: bmal1-wt (n=4–12 per time point). Red bars: bmal1−/− littermates (n=3–11 per time point). Each group is composed of equal or near-equal proportions of male and female animals, and was pooled from 2 independent rounds of infection. (d) Lung viral load measured by plaque assay at various points after SeV infection (5.0x10⁴ pfu). Each bar represents the mean SeV plaque forming units/g of lung ± SE. Blue bars: bmal1-wt (n=5–6 per time point). Red bars: bmal1−/− littermates (n=4–6 per time point). (e) Comparison of SeV potency in bmal1−/− and wt littermate mice using weight loss as an indicator of severity. Each bar represents the weight minimum (normalized to starting weight) achieved using various doses of SeV (mean ± SE). Blue bars: bmal1-wt (n=5–21 per time point). Red bars: bmal1−/− littermates (n=8–9 per time point). Data were pooled from 4 independent experiments utilizing equal or near equal proportions of male and female mice. Note that sham (PBS) inoculated animals did not exhibit appreciable weight loss (data not shown). (f) Animal weights (normalized to starting weight) after infection with 5 pfu H1N1 IAV. Each point represents the mean weight ± SE. Blue squares: bmal1-wt (n=6). Red diamonds: bmal1−/− littermates (n=8). Equal proportions of male and female animals were used in each group. At the dose of virus tested, we did not encounter mortality in IAV infected bmal1−/− or wt animals during the acute infection. *p<0.05 bmal1−/− vs. wt littermates (Student’s 2-Tailed t-test).

