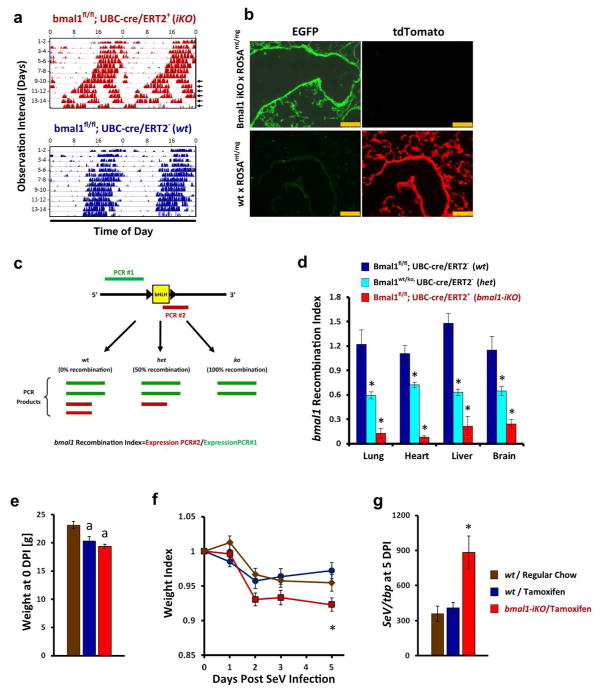
Figure 2.
Post-natal deletion of bmal1 is sufficient to exacerbate acute SeV respiratory infection. (a) Representative actigraphy depicting wheel running behavior of bmal1-iKO (bmal1fl/fl, UBC-cre/ERT2+) and non-iKO (bmal1fl/fl, UBC-cre/ERT2+) littermates, kept in constant darkness and fed tamoxifen-containing chow starting on the first day of recording. Bars represent wheel revolutions per minute and each row represents a 2 day interval of observation. Note that circadian rhythms in wheel running activity begin to break down in bmal1-iKO after 9–10 days of tamoxifen exposure (arrowheads). (b) Representative micrographs depicting cre recombination efficiency in the lungs of bmal1-iKO mice and wt mice. Bmal1-iKO and wt littermate mice were crossed with ROSAmT/mg reporter line, fed tamoxifen for 3 weeks (see Methods), and then frozen lung sections were prepared. Cre recombination efficiency is indicated by the development of EGFP (green) fluorescence and the reciprocal loss of mtTomato (red) fluorescence in cells. Scale bar=250 μm. (c) Schematic of qPCR based assay to quantify bmal1 recombination efficiency in bmal1-iKO mice. The genomic locus of bmal1 for the B6.129S4(Cg)-Arntltm1Weit/J mouse line used in this study is depicted in simplified form (black line) to illustrate the loxP sites flanking exon 8, which encodes the bHLH DNA binding domain. PCR product #1 (green) extends from exon 5–8, terminating upstream of the floxed bHLH coding sequence and therefore its production is insensitive to Cre activity. In contrast, PCR product #2 (red) initiates within the floxed bHLH coding sequence and therefore is not amplified in mRNA templates where Cre recombination has occurred. The efficiency of bmal1 recombination can therefore be expressed as the ratio of bmal1 expression detected by PCR product #2/PCR product #1. (d) Quantification of bmal1 recombination in iKO mice using qPCR. Bars represent mean bmal1 recombination index (see Methods and panel c) ±SE. Dark blue bars, bmal1-wt mice fed tamoxifen chow (no recombination, 100% bmal1gene dosage; n=6). Light-blue bars, global bmal1 heterozygous mice containing a ko/wt, genotype (i.e. 50% gene dosage; n=4). Red bars, bmal1-iKO mice fed tamoxifen chow (n=7). Note that global bmal1-null mice (where recombination occurs in utero) generate a recombination index of 0 in this assay (data not shown). *p<0.05 vs. wt littermates fed tamoxifen chow (Student’s 2-Tailed t-test). (e) Weight of bmal1-iKO and wt mice after 3 weeks of tamoxifen feeding. Bars represent mean weight ±SE. Brown bars: wt mice fed regular chow. Dark blue bars, wt mice fed tamoxifen chow. Red bars: bmal-iKO mice fed tamoxifen chow. ap<0.05 vs. wt littermates fed regular chow (Student’s 2-Tailed t-test). Data is pooled from 2 independent experiments (n=6–10 per group, equal proportions of male and female mice). (f) Animal weights (normalized to starting weight) after infection with 5x10⁴ pfu SeV. Each point represents the mean ± SE. Bar color designations and sample sizes are as described in panel e above. Data is pooled from 2 independent experiments. *p<0.05 bmal1−/− vs. wt littermates fed tamoxifen chow (Student’s 2-Tailed t-test). (g) SeV RNA expression as measured by qPCR 5 days after intranasal infection with SeV (5x10⁴ pfu). Each bar represents the mean SeV gene expression normalized to tbp ± SE. Bar color designations and sample sizes are as described in panel e above. Data is pooled from 2 independent experiments. *p<0.05 bmal1−/− vs. wt littermates fed tamoxifen chow (Student’s 2-Tailed t-test).

