Figure 3.
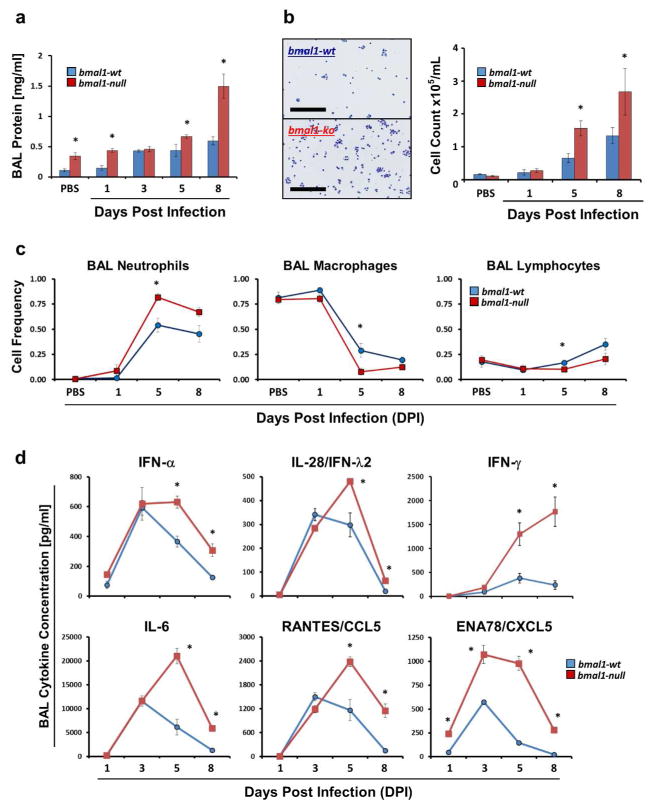
Airway inflammation during acute viral infection is greater in bmal1−/− mice than wt. (a) Bronchio-alveolar lavage (BAL) protein content in mg/ml (mean ± SE). Blue bars: bmal1-wt (n=4–14 per time point). Red bars: bmal1−/− (n=4–6 per time point). Equal or near-equal proportions of male and female animals were included in each group. (b) Representative images of BAL cytospins of bmal1-wt and bmal1−/− mice during acute infection and cell counts at 1, 5, and 8 days after infection with SeV (5x10⁴ pfu). Each bar represents the mean number of cells/mL of BAL fluid ± SE. Blue bars: bmal1-wt (n=4–14 per time point). Red bars: bmal1−/− littermates (n=4–6 per time point). Each group is composed of equal or near-equal proportions of male and female animals. Scale bars within the representative pictures represent 200μm. (c) Frequency of macrophages, neutrophils, and lymphocytes present in BALs of bmal1-wt (blue symbols, n=4–14 per time point) and bmal1−/− (red symbols, n=4–6 per time point) animals at various time points post SeV infection (5x10⁴ pfu). Each bar represents the mean frequency of each cell type ± SE. Groups of mice were composed of equal or near-equal proportions of male and female animals. (d) BAL cytokine concentration in bmal1-wt and bmal1−/− animals at various time points after infection with SeV (5x10⁴ pfu). Each point represents the mean cytokine concentration ± SE. Blue circles: bmal1-wt (n=4–14 per time point). Red squares: bmal1−/− (n=4–6 per time point). Each group is composed of equal or near-equal proportions of male and female animals. *p<0.05 bmal-wt vs bmal−/− (Student’s 2-Tailed t-test).

