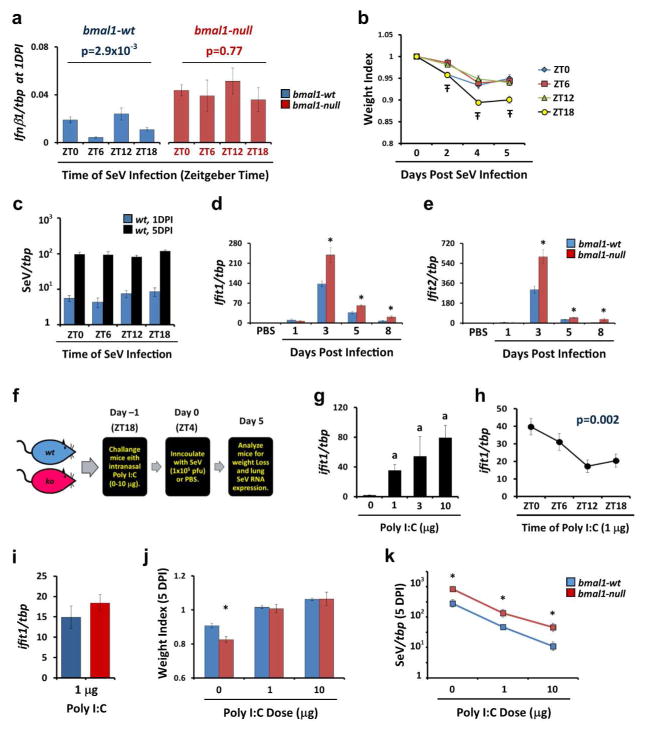
Figure 4.
Interferon-related antiviral responses are altered in bmal1−/− mice. (a) Expression of ifnb1 measured by qPCR 24 hours after inoculation with SeV (5x10⁴ pfu). Inoculation was conducted at various times of day represented in Zeitgeber Time (ZT) where ZT0 represents “lights on” and ZT12 represents “lights off”. Each bar represents the mean ifnb1 expression normalized to tbp ± SE. Blue bars: bmal1-wt (n=9–12 per time point). Red bars: bmal1−/− (n=6–7 per time point). Depicted data was pooled from two independent time series, each showing similar time-dependence in ifnb1 expression. Statistical significance was determined by 1-way ANOVA. Note that lung infb1/tbp ratios in sham (PBS) treated mice were negligible at the ZTs tested, ranging from 2.3–4.4x10⁻⁴ in wt mice. (b) Weight loss (mean ± SE, n=10 per group) after inoculating male wt mice with SeV (5x10⁴ pfu) at various ZTs. Data was pooled from 2 independent experiments. Ŧp<0.05, 1-way ANOVA. (c) SeV RNA expression at 1DPI (blue bars) and 5DPI (black bars) after inoculating wt mice with SeV (5x10⁴ pfu) at various ZTs. Data was pooled from 2 independent experiments (n=9–12 per group). (d, e) Gene expression of ifit1 (d), and ifit2 (e) normalized to tbp. Each bar represents the mean expression ± SE at various time points after infection with SeV (5x10⁴ pfu). Blue bars: bmal1-wt (n=4–14 per time point). Red bars: bmal1−/− littermates (n=4–6 per time point). Each group is composed of equal or near-equal proportions of male and female animals pooled from 2 independent rounds of SeV infection. *p<0.05 bmal1-wt vs bmal−/−(Student’s 2-Tailed t-test). (f) Cartoon depicting our protocol for pre-activating interferon responses in mice prior to SeV challenge using the TLR3 agonist Poly (I:C) (also see Methods). Mice received an intranasal challenge of Poly (I:C) and the following morning were inoculated with SeV. The mice were then harvested at 5DPI to assess SeV viral load. (g) Dose response relationship between intranasal Poly (I:C) and stimulation of interferon responses as reflected by induction of ifit1 expression. wt male mice were challenged with the indicated amount of Poly (I:C) and lungs were obtained for qPCR analysis on Day 0 as depicted in panel (f). Bars represent mean ifit1/tbp ratios ± SE (n=3 per group). ap<0.05 vs. PBS treated wt mice (Student’s 2-Tailed t-test). (h) Induction of lung ifit1 expression in wt male mice by 1 μg intranasal Poly (I:C) administered at different ZTs. Data points represent mean ifit1/tbp ratios ± SE (n=9 per data point, pooled from 3 independent experiments). For each data point, lungs were collected 12 hours after Poly (I:C) inoculation. (i) Induction of ifit1 expression by 1 μg Poly (I:C) in bmal1−/− (red bars) and wt (blue bars) littermates. Bars represent mean ifit1/tbp ratios ± SE (n=5–6 per group, pooled from 2 independent experiments). Male and female mice were used in equal or near equal proportion in these experiments. (j) Effect of Poly (I:C) pre-treatment on weight loss after SeV infection (1x10⁵ pfu) in bmal1−/− (red bars) and wt (blue bars) littermates. Bars represent mean weight ± SE at 5 DPI, expressed as a fraction of the starting weight (n=6–30 per group). Data depicted was pooled from 2–4 independent experiments per dose of Poly (I:C) and employed male and female mice in equal or near equal proportion. *p<0.05 bmal1-wt vs bmal−/− (Student’s 2-Tailed t-test). (k) Effect of Poly (I:C) pre-treatment on SeV RNA expression in bmal1−/− (red bars) and wt (blue bars) littermates, 5 days after infection (1x10⁵ pfu). Data points represent mean SeV/tbp ratios ± SE at 5 DPI (n=9–35 per group). Data depicted was pooled from 3–4 independent experiments per dose of Poly (I:C), each showing similar results, and employed male and female mice in equal or near equal proportion. *p<0.05 bmal1-wt vs bmal1−/− (Student’s 2-Tailed t-test).

