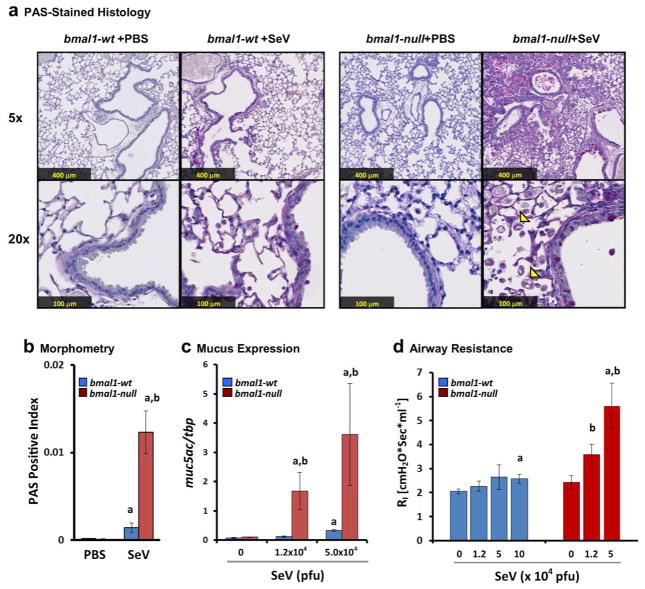
Figure 5.
Deletion of bmal1 exacerbates chronic lung disease after SeV Infection. (a) Representative micrographs of PAS stained lung sections at day 49 after sham (PBS) or SeV (5 x 10⁴ pfu). For each panel the upper picture is at 5x magnification and the lower is at 20x. Note the increased distortion of lung architecture in SeV challenged bmal1−/− mice compared to wt and the infiltration of crystal-laden macrophages (arrowheads). (b) Quantification of PAS+ staining in SeV-infected or sham (PBS treated) bmal1−/− and wt littermate lung sections at 49 DPI (red and blue bars respectively). Bars represent the mean ratio of PAS+ (magenta) pixels to total pixels ± SE. (c) Expression of muc5ac at day 49 as a function of SeV inoculum. Each bar represents the mean expression ± SE normalized to the housekeeping gene tbp. Blue bars: bmal1-wt (n=5–9 per group). Red bars: bmal1−/− littermates (n=3–6 per group). (d) Airway resistance at day 49 as a function of SeV inoculum. Each bar represents the mean airway resistance ± SE. Blue bars: bmal1-wt (n=5–9 per group). Red bars: bmal1−/− littermates (n=3–6 per group). ap<0.05 SeV-infected vs. PBS-control (Student’s 2-Tailed t-Test), bp<0.05 SeV-infected bmal1−/− vs. wt (Student’s 2-Tailed t-test).

