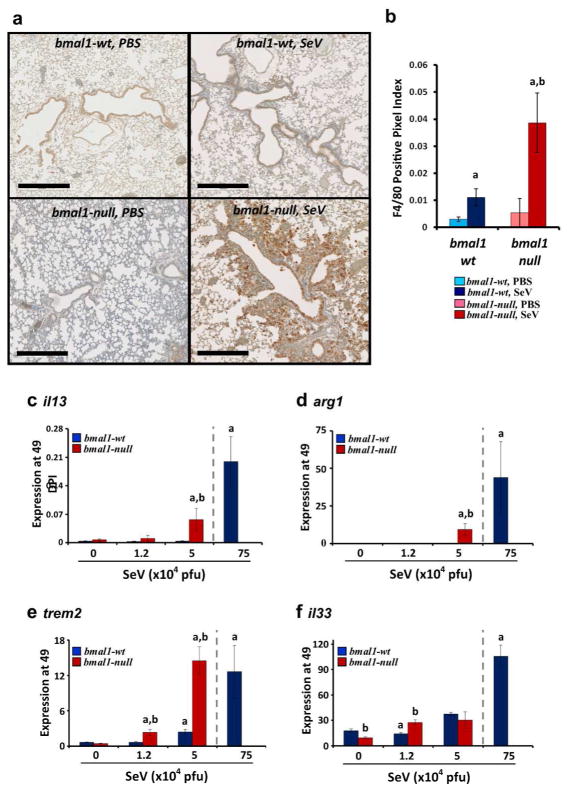
Figure 6.
Expression of M2 signatures is enhanced in bmal1−/− mice post-SeV infection. (a) Representative images of lungs at 49 DPI stained with macrophage marker F4/80. Scale bar=500 μm. (b) Quantification of F4/80+ staining in immunohistochemical sections expressed as a fraction of positive stained pixels (mean expression ± SE, n=3–4 per group). ap<0.05 versus sham (PBS) infected wt controls, bp<0.05 bmal1−/− vs. wt (Student’s 2-Tailed t-test). (c–f). Mice were infected with the indicated dose of SeV, and at 49DPI lungs were harvested and analyzed for gene expression using tbp as a housekeeping gene. As a positive control, lung gene expression in wt mice exposed to a high dose of SeV (75x104 pfu) is depicted to the right in each panel and separated by a dashed line. Each bar represents the mean expression ± SE. (c) il13 expression. (d) arg1 expression. (e) trem2 expression. (f) il33 expression. Red bars indicate bmal1−/− mice (n=3–4 per group), and blue bars denote wt littermates (n=5–9 per group). ap<0.05 versus sham (PBS) infected wt controls, bp<0.05 bmal1−/− vs. wt (Student’s 2-Tailed t-test). Equal or near equal numbers of male and female mice were utilized per group.

