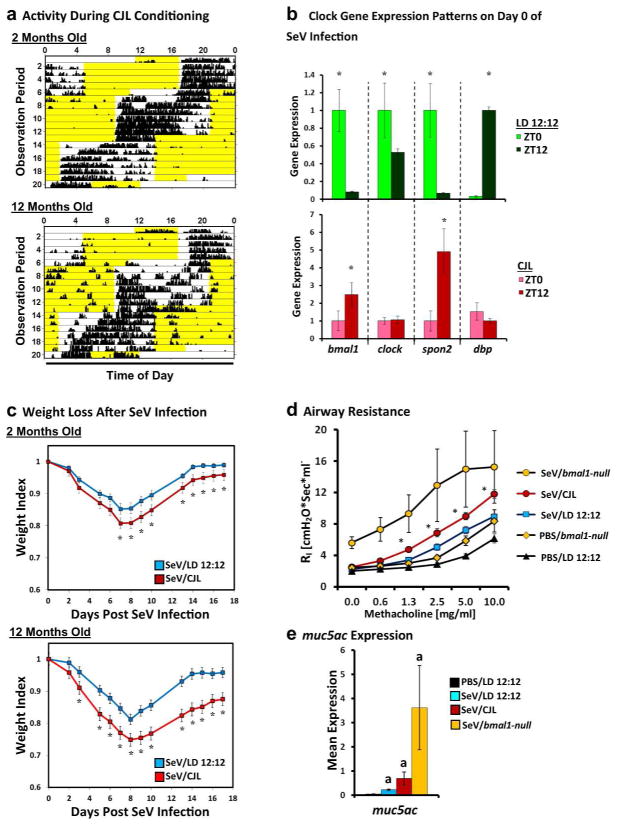
Figure 7.
Effect of chronic jet lag (CJL) on acute and chronic SeV lung pathology. (a) Representative actigraphs depicting wheel running activity during CJL conditioning, which consisted of weekly 8-hour phase advances in juvenile (2 months old, upper panel) and middle aged (12 months old, lower panel) mice. Black vertical bars represent wheel revolutions per epoch, and each row represents one day of recording. Yellow highlighted regions represent lights-on. (b) Expression of various clock genes at subjective dawn (ZT0) and dusk (ZT12) for mice living under standard 12 hour day-night lighting (LD 12:12, green bars) or CJL (red bars) after the final phase advance in our protocol. Each bar represents the mean expression ± SE (n=3 per group). For each clock gene, expression is normalized to the housekeeping gene tbp and then further standardized to mean expression at ZT0 for ease of viewing. The data depicted was obtained from middle aged mice, but similar changes were observed in juvenile mice subjected to CJL. *p<0.05 ZT0 vs. ZT12 (Student’s 2-Tailed t-test). (c) Weight loss in standard-housed (blue line, n=7–15 per group) and CJL conditioned (red line, n=12–15 per group) mice after infection with SeV (1.5x10⁵ pfu). Data represents the mean weight index ± SE and is representative of two independent experiments. Note that we did not encounter significant mortality in either CJL or control mice during acute SeV infection for these experiments. *p<0.05 CJL vs. LD12:12 (Student’s 2-Tailed t-test). Male mice were used for these experiments. (d) Airway resistance in SeV-infected mice at 49 DPI (1.5x10⁵ pfu) that were conditioned with CJL or standard lighting (LD 12:12). Each line represents the mean airway resistance measured after doubling doses of methacholine ± SE. Orange circles: SeV-infected bmal1-null mice (n=3). Red circles: SeV-infected, CJL conditioned mice (n=11). Blue Squares: SeV-infected mice under normal lighting conditions (n=9). Black triangles: PBS-treated mice under normal lighting conditions (n=5). Orange diamonds: PBS-treated bmal1-null mice (n=6). *p<0.05 SeV/CJL vs. SeV/LD 12:12 (Student’s 2-Tailed t-test). (e) Lung expression of muc5ac at 49 DPI with SeV. Each bar represents the mean muc5ac expression normalized to tbp ± SE. Black bar: PBS-treated mice under normal lighting conditions (n=5). Blue bar: SeV-infected mice under normal lighting conditions (n=9). Red bar: SeV-infected mice subjected to CJL protocol before infection (n=11). Yellow bar: SeV-infected, bmal1-null mice under normal lighting conditions (n=3). Note that in panels (d) and (e), the bmal1−/− mice depicted were inoculated with 5x10⁴ pfu, as this was the highest dose that was below the LD50 in this genotype. ap<0.05 vs PBS/LD 12:12 (Student’s 2-Tailed t-test).

