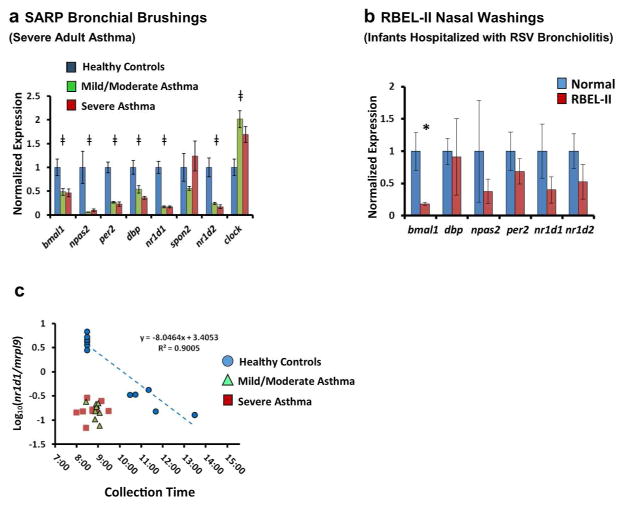
Figure 8.
Differential expression of clock genes in airway samples from two asthma cohorts. (a) Expression of circadian clock genes in bronchial brush samples obtained from adult patients with severe asthma (n=9, red bars), mild/moderate asthma (n=9, green bars), and healthy volunteers (n=6, blue bars) who participated in SARP. All samples were collected between 0800 and 0930 hours. Bars represent mean expression ratios±s.e. normalized to mrpl9. To simplify the visual depiction of data, expression was then further normalized to the mean for non-asthmatic control subjects. ‡P<0.05 (one-way ANOVA). (b) Clock gene expression in nasal wash samples previously obtained from young children hospitalized for RSV bronchiolitis (n=10, red bars) and control subjects (n=5, blue bars) who participated in RBEL-II. All samples were collected between 1015 1220 hours. Bars represent mean expression ratios±s.e. normalized to mrpl9. To simplify the visual depiction of data, expression was then further normalized to the mean for non-asthmatic control subjects. (c) Log10 normalized nr1d1/mrpl9 expression ratios from SARP participants (Mean±s.e.), graphed as a function of collection time. Blue circles: healthy volunteers (n=11). Green triangles: mild/moderate asthma (n=9). Red squares (severe asthma, n=9). A regression line is depicted for the healthy control samples (blue dashed line). Extrapolating from this line, the time difference that would be needed to reproduce the nr1d1 expression seen in asthmatic subjects using healthy controls is 3.61±0.14 h for mild/moderate asthmatics, and 3.91±0.26 h for severe asthmatics. *P<0.05 (Student’s two-tailed t-test). ANOVA, analysis of variance; RSV, respiratory syncytial virus; SARP, Severe Asthma Research Program.

