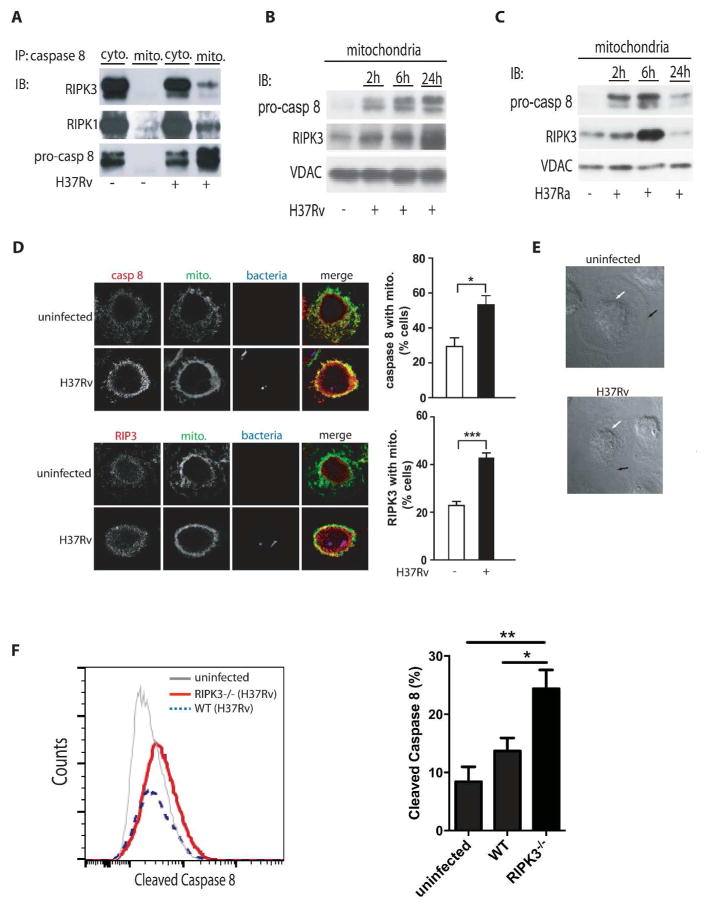
Figure 2. translocation of a RIPK3/pro-caspase 8 containing complex to the mitochondria of H37Rv-infected Mφ.
(A) Cytosolic and mitochondrial RIPK3 and pro3 caspase-8 following H37Rv infection. Equal numbers of human Mφ were infected with H37Rv (MOI 10) and lysed for isolation of cytosolic and mitochondrial fractions after 24 h of infection. Equal amounts of protein were immunoprecipitated (IP) with anti-caspase-8 ab and the levels of RIPK3, RIPK1, and pro-caspase 8 were measured by Western blot analysis. (B-C) Time7 dependent translocation of RIPK3 and pro-caspase 8 to the mitochondria. Equal numbers of Mφ were infected with virulent H37Rv or (B) avirulent H37Ra (C) at MOI 10. The levels of pro9 caspase 8 and RIPK3 were determined by subjecting equal amounts of mitochondria isolated from infected Mφ to Western blotting. VDAC was used as a loading control. (D) Colocalization of caspase 8 and RIPK3 with the mitochondria of H37Rv-infected Mφ. Left panels: Colocalization of RIPK3 and pro-caspase 8 with mitochondria 24h after infection visualized by confocal fluorescence microscopy. Human Mφ remained either uninfected or were infected with mCherry- H37Rv (MOI 10) for 24h, fixed and stained with mitotracker (green) and anti-RIPK3 or anti caspase 8 ab (red). Scale bar, 30 μm. On the right side of every panel is the quantification of caspase 8 (top) and of RIPK3 (bottom) associated with the mitochondria. Data were analyzed using nonparametric Student t test (E) Phase-contrast images of representative infected and uninfected human primary Mφ after 24 h of infection show approximate location of the plasma membrane and the nucleus as indicated by black and white arrows, respectively. Due to incipient necrosis the plasma membrane of the H37Rv-infected Mφ is not clearly visible. (F) BMD-Mφ from WT and RIPK3−/− mice were infected with H37Rv at an MOI of ~10. After 12 h, expression of cleaved caspase 8 was assessed using flowcytometry. Results are represented as mean ± SD. Data were analyzed using one-way ANOVA. *,**,*** Values of P < 0.05, P<0.01 and P<0.001, respectively were considered to be significant. Data are representative of 2–3 independent experiments.

