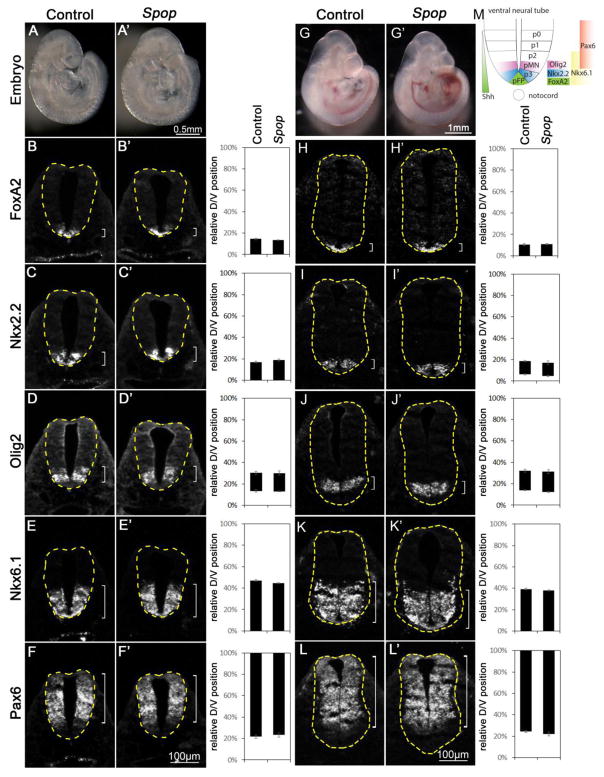
Fig. 2. Normal ventral patterning of the Spop mutant spinal cords.
(A, A′) Lateral views of E9.5 control (A) and Spop (A′) mutant embryos. (B–F′) Immunofluorescent images of transverse sections of E9.5 control (n=4 embryos) and Spop mutant (n=4 embryos) spinal cords at the forelimb level with indicated antibodies. (G, G′) Lateral views of E10.5 control (G) and Spop (G′) mutant embryos. (H–L′) Immunofluorescent images of transverse sections of E10.5 control (n=4 embryos) and Spop mutant (n=4 embryos) spinal cords at the forelimb level. The spinal cords are outlined with dash lines. Brackets indicate the expression domains. The span of each domain along the D/V axis is quantified and shown on the right. Relative D/V position is shown as the distance to the ventral-most point of the spinal cord as a percentage of the entire D/V span of the spinal cord. Student’s t-test suggests no significant difference between Spop mutant and control groups. (M) A schematic illustration of ventral spinal cord patterning at E10.5 depicting the arrangement of various progenitor groups and the expression domains of marker genes in wild type embryos.

