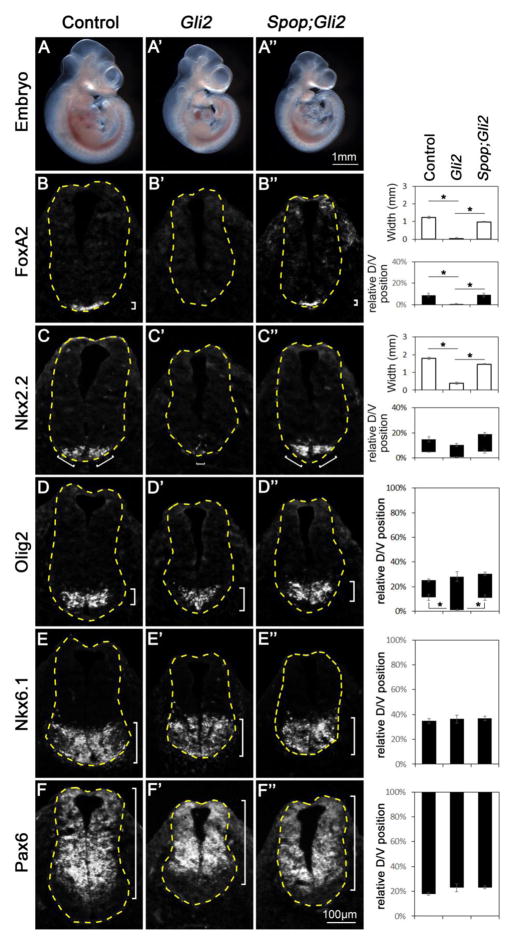
Fig. 4. Restored floor plate and V3 interneuron progenitor fates in Spop;Gli2 double mutants.
(A–A″) Lateral views of E10.5 control (A), Gli2 mutant (A′) and Spop;Gli2 double mutant (A″) embryos. (B–F″) Immunofluorescent images of transverse sections of E10.5 control (n=3 embryos), Gli2 mutant (n=3 embryos) and Spop;Gli2 (n=3 embryos) double mutant spinal cords at the forelimb level with indicated antibodies. The spinal cords are outlined with dash lines. Brackets indicate the expression domains. The span of each domain along D/V axis is shown on the right. Relative D/V position is shown as the distance to the ventral-most point of the spinal cord as a percentage of the entire D/V span of the spinal cord. The width of Foxa2 and Nkx2.2 domains is also quantified (hollow columns). (B–B″) Foxa2 was present in the ventral-most region of the control and diminished in the Gli2 mutant, but restored in the Spop;Gli2 double mutant spinal cords. Student’s t-test was employed to compare the width of floor plate. *: p<0.05. (C–C″) Nkx2.2 was present in juxtaposition to floor plate of the control but diminished in the Gli2 mutant, and was restored in the Spop;Gli2 double mutant spinal cords. Student’s t-test was employed to compare the size of V3 interneuron progenitor domain. *: p<0.05. (D–D″) Olig2 expression was excluded from the ventral-most region of control and Spop;Gli2 double mutant but expanded ventrally in Gli2 mutant spinal cords. Student’s t-test was employed to compare the distance from the Olig2 expression domain to the ventral-most point of the spinal cords. *: p<0.05. (E–F″) Nkx6.1 and Pax6 expression domains remained unchanged in the Gli2 mutant and Spop;Gli2 double mutant spinal cords.

