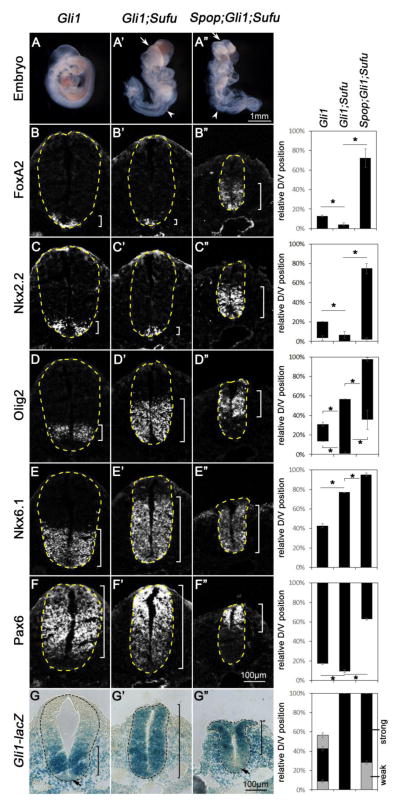
Fig. 8. Loss of Spop rescued the floor plate and V3 interneuron progenitor fates in Gli1;Sufu double mutant embryos.
(A–A″) Lateral views of E9.5 Gli1 mutant (A), Gli1;Sufu double mutant (A′) and Spop;Gli1;Sufu triple mutant (A″) embryos. Arrows in A′ and A″ indicate exencephaly; white arrowheads indicate spina bifida; red arrowheads indicate edema. (B–G″) Immunofluorescent (B–F″) or Xgal-stained (G–G″) images of transverse sections of the E9.5 Gli1 mutant (n=3 embryos), Gli1;Sufu double mutant (n=3 embryos) and Spop;Gli1;Sufu triple mutant (n=3 embryos) spinal cords at the thoracic level. The spinal cords are outlined with dash lines. Brackets indicate the expression domains. The span of each domain along the D/V axis is shown on the right. Relative D/V position is shown as the distance to the ventral-most point of the spinal cord as a percentage of the entire D/V span of the spinal cord. Student’s t-tests were performed to compare the dorsal and ventral borders of expression domains of various genes. *: p<0.05. (B–C″) The expression of Foxa2 and Nkx2.2 in the ventral-most region of Gli1 mutant was diminished in Gli1;Sufu double mutant, but expanded dorsally in the Spop;Gli1;Sufu triple mutant spinal cords. (D–D″) Olig2 expression was expanded both ventrally and dorsally in Gli1;Sufu double mutant, but was dorsally restricted in the Spop;Gli1;Sufu triple mutant spinal cords. (E–E″) Nkx6.1 expression domain was expanded dorsally in the Gli1;Sufu double mutant and more dorsally in the Spop;Gli1;Sufu triple mutant spinal cords. (F–F″) Pax6 expression domain was expanded ventrally in the Gli1;Sufu double mutant, and restricted to the more dorsal region in the Spop;Gli1;Sufu triple mutant spinal cord. (G) Gli1-lacZ expression formed a ventral-to-dorsal gradient in the Gli1 mutant spinal cord, with the exception of the floor plate, in which Gli1-lacZ has been downregulated. (G′) Strong Gli1-lacZ expression is present throughout the entire spinal cord of Gli1;Sufu double mutant. (G″) Gli1-lacZ is highly expressed in the dorsal, but not ventral region of the Spop;Gli1;Sufu triple mutant spinal cords.

