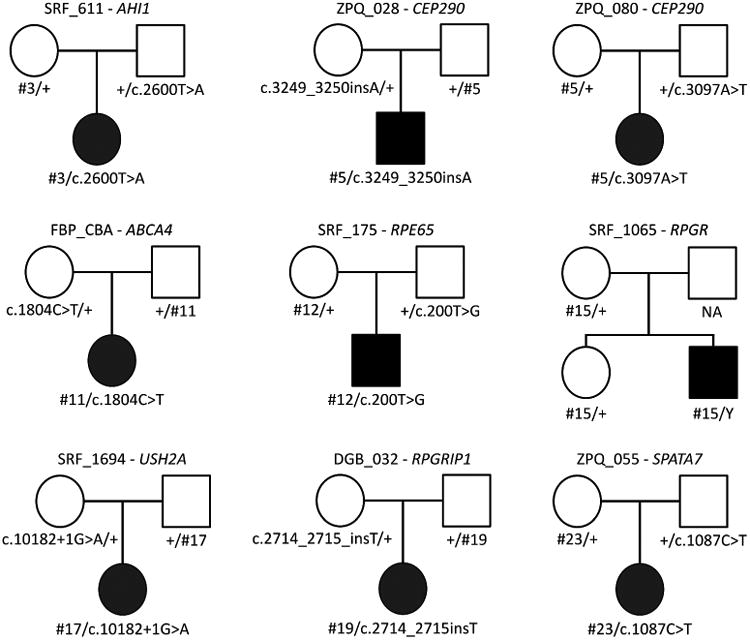
Figure 1. Pedigrees for nine of the probands passing segregation for their candidate splicing variant.

Circles represent females, squares males. Solid shapes indicated the affected proband while empty shapes are unaffected relatives. The NA indicates a father whose DNA was unavailable. The candidate splicing variant is indicated by its number (#) ID which can be compared to Table 1. cDNA change annotations are taken from Table 1 where corresponding gene models are noted.
