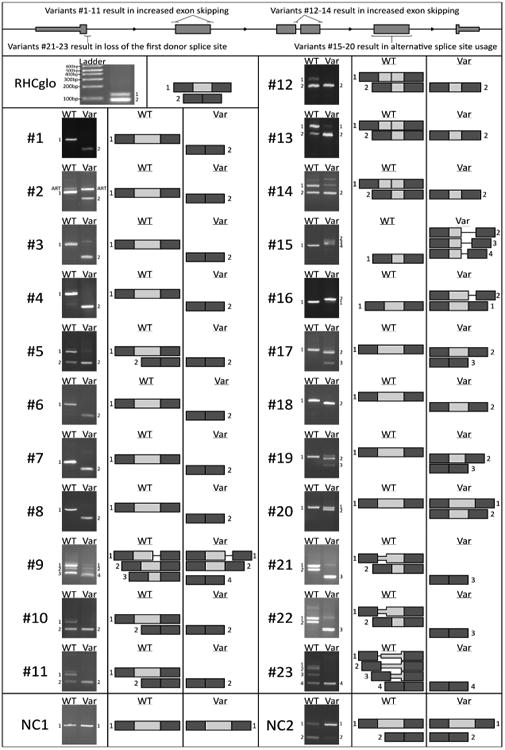
Figure 2. A minigene splicing assay reveals variant-induced aberrant splicing.

Gel electrophoresis of RT-PCR products for all tested minigenes. The control minigene is unmodified RHCglo containing a ∼50 base pair exon that displays partial exon inclusion. Numbers (#) refer to the splicing variant ID while NC1 and NC2 refer to the two negative control variants tested. The differences between the respective wildtype (WT) and variant (Var) band composition reveal the variant-induced changes in splicing. The adjacent diagrams, which are not to scale, are provided as a schematic of the variant-induced changes in transcript configuration. Dark gray exons correspond to the first and last exon of the minigene, light gray exons correspond to the exons cloned in for variant testing, a line corresponds to the flanking introns included for variant testing. A band labeled ART indicates an artefact of the minigene construction process which does not correspond to a possible endogenous splicing event.
