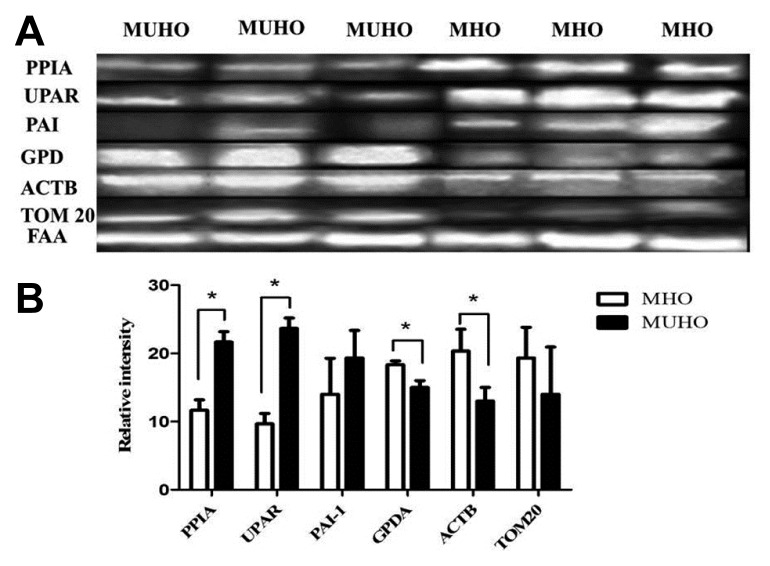
Fig. 2.
Confirmation of the proteomic data using immunoblot analysis of selected proteins, identified by 2D-DIGE analysis.
(A) The results obtained by immunoblotting were similar to the results obtained by 2D-DIGE. (B) Graphical representation of the relative intensity values of normalized protein bands for MHO and MUHO. The data are presented as histograms of mean ± SD.

