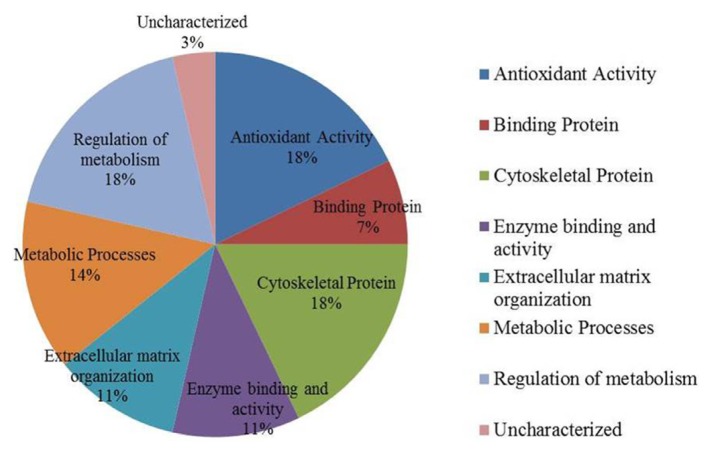
Fig. 4.
Comparative depiction of the differentially abundant identified proteins categorized into groups according to their function based on the GO terms using UniprotKB.
The representative pie diagram shows the (%) of involvement for different functional categories of the proteins between MHO and MUHO group.

