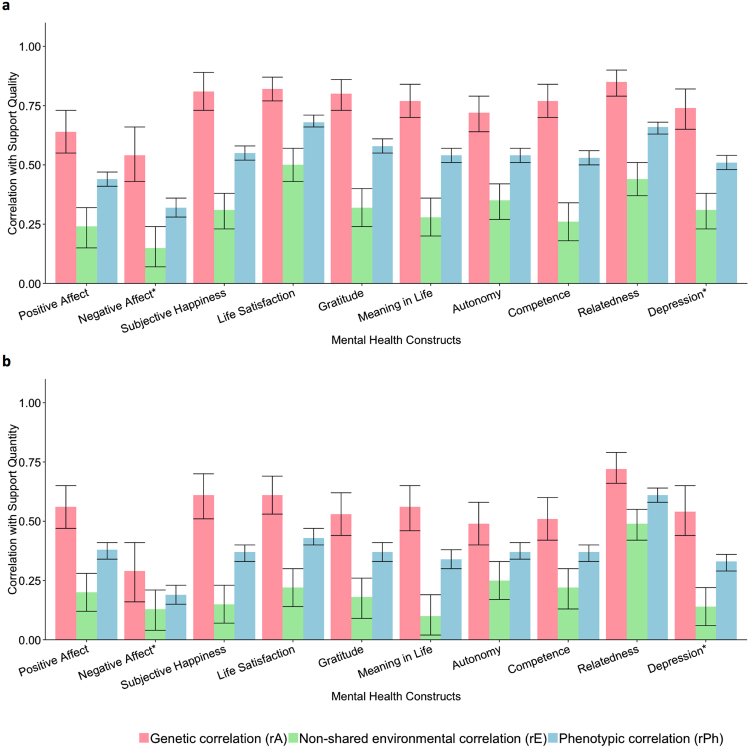
Figure 1.
Genetic, non-shared environmental and phenotypic correlations with 95% confidence intervals. The results here are obtained from bivariate AE model fitting using Cholesky decomposition, presented in the form of a mathematically equivalent correlated factors solution, which provides estimates of genetic and environmental correlations between our measures. All correlations were in the expected direction with higher levels of both support quality and quantity associated with higher levels of wellbeing and lower levels of depression. *For comparative purposes, correlations with negative affect and depression shown here are absolute, as measures are negatively correlated with both support measures (a) Correlations between support quality (total score) and mental health constructs. Absolute average phenotypic correlations between total support quality score and mental health = 0.54. Absolute average genetic correlation = 0.75, absolute average non-shared environmental correlation = 0.32. (b) Correlations between support quantity and mental health constructs. Absolute average phenotypic correlations between support quantity score and mental health = 0.38. Absolute average genetic correlation = 0.54, absolute average non-shared environmental correlation = 0.21.

