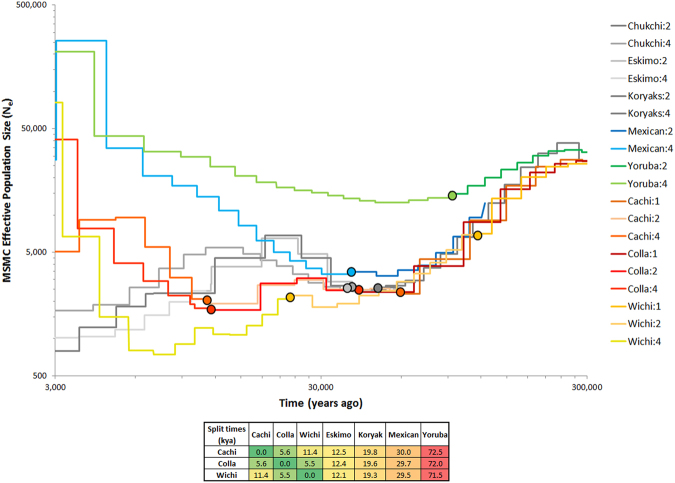
Figure 1.
MSMC plot, effective population sizes and split times of Collas, Native American lowlanders, Siberians and Africans. Effective population size (Ne) and split time estimates are based on 1, 2 or 4 genomes for the Native Americans and on 2 and 4 genomes for the other populations. Coloured dots show where the MSMC curves based on 1, 2 or 4 genomes were joined together to provide a comprehensive representation of the changes in Ne over time for each of the analysed population. Around 100,000 years the out of Africa exit starts to reduce population size in non-Africans. Yoruba show a limited decline as they remain in Africa. Ne of Collas rises up to 30,000 units 3,000 years ago. Andean highlanders: Collas; Calchaquíes (Cachi): intermediate altitude population in Argentina (2300 m); American lowlanders: Mexican, Wichí; Siberians: Eskimo, Koryaks, Chukchi.

