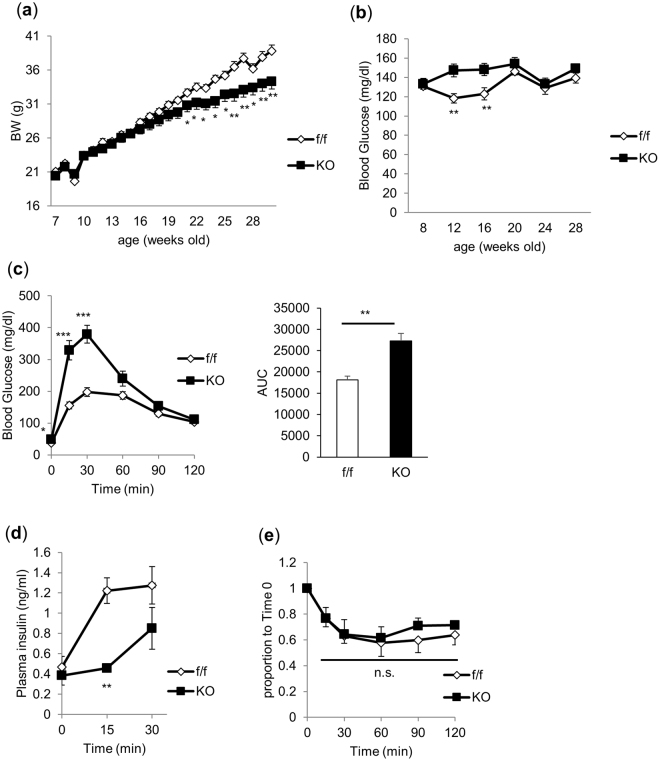
Figure 2.
TFGloxP/loxP; MIP-Cre mice showed glucose intolerance with impaired insulin secretion. (a) Body weight (normal chow, n = 11–12). (b) Blood glucose levels (normal chow, n = 11–12). (c) Blood glucose levels and area under the curve on IPGTT (9-week-old mice, 2 g/kg i.p., n = 6–7). (d) Plasma insulin levels in response to intraperitoneal glucose injection (17 to 19-week-old mice, 2 g/kg i.p., n = 4–5). (e) ITT (10-week-old mice, 0.75 U/kg i.p., n = 4–5). *P < 0.05, **P < 0.01, ***P < 0.001.

