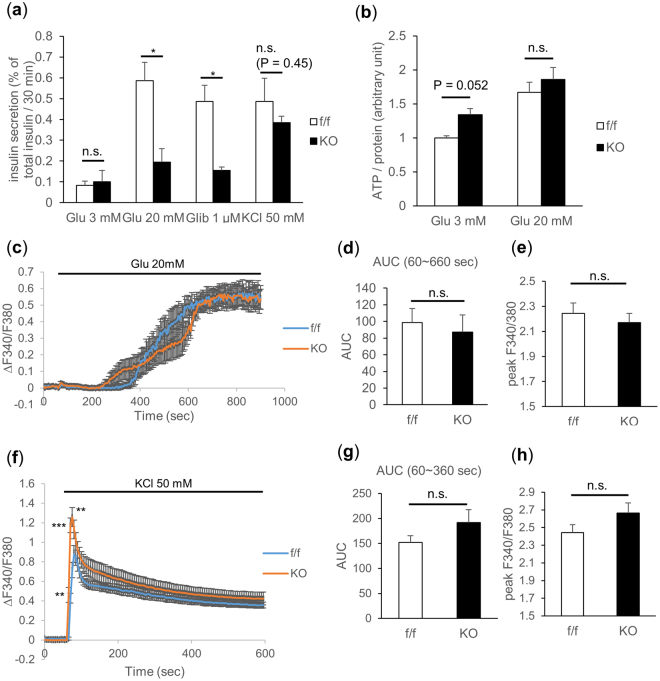
Figure 5.
TFG knockout in β-cells severely impaired glucose-stimulated insulin secretion. (a) Insulin secretion from isolated islets when stimulated with glucose (3 mM, 20 mM), glibenclamide (1 μM) or KCl (50 mM) for 30 min. The percentage of secreted insulin over islet insulin content (determined from the insulin concentration of the lysates) is shown (10-week-old mice, n = 3–4). (b) Islet ATP content (normalized by the protein content, 13-week-old mice, n = 3–5). (c–h) Analysis of intracellular Ca2+ concentration when stimulated with 20 mM glucose (c–e) or 50 mM KCl (f–h). (c,f) The changes in the Fura-2 ratio (ΔF340/F380) from the time of stimulation (60 sec) are demonstrated. The average of 5–7 independent measurements is shown (8 to 10-week-old mice). (d–g) Area under the curve during the 10 min (for glucose stimulation) or the 5 min (for KCl stimulation) from the time of stimulation (60 sec). (e,h) Peak Fura-2 ratio (F340/F380). *P < 0.05, **P < 0.01, ***P < 0.001.

