Figure 6.
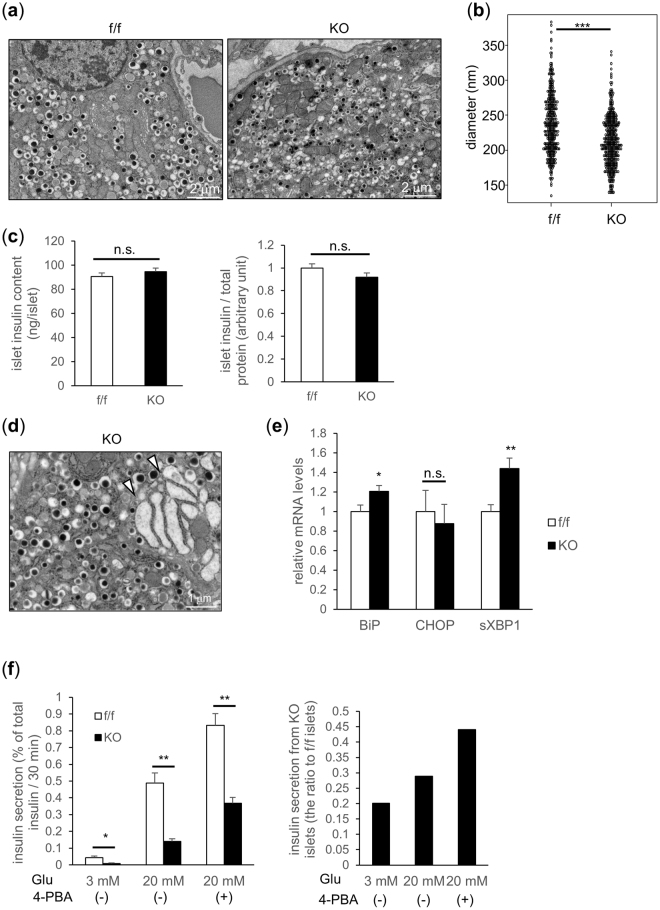
TFG depleted β-cells display smaller insulin crystals and mild ER stress. (a) Representative electron microscopic images of β-cells from 10-week-old f/f and KO mice (scale bars: 2 μm). (b) Insulin crystal diameter inside the granules (f/f: n = 377, KO: n = 435). (c) Islet insulin content (19-week-old mice, n = 8) (left: ng/islet, right: adjusted by the protein concentration). (d) Dilatation of the ER lumen observed in TFG KO β-cell (scale bar: 1 μm). White arrowheads indicate dilated rough ERs. (e) mRNA levels of ER-stress markers in isolated islets (10-week-old mice, n = 6). (f) Glucose-induced insulin secretion from isolated islets treated with or without a chemical chaperone (4-PBA) (20-week-old mice, n = 3–5). The ratio of insulin secretion from KO islets to that from f/f islets is shown in the right panel. *P < 0.05, **P < 0.01, ***P < 0.001.

