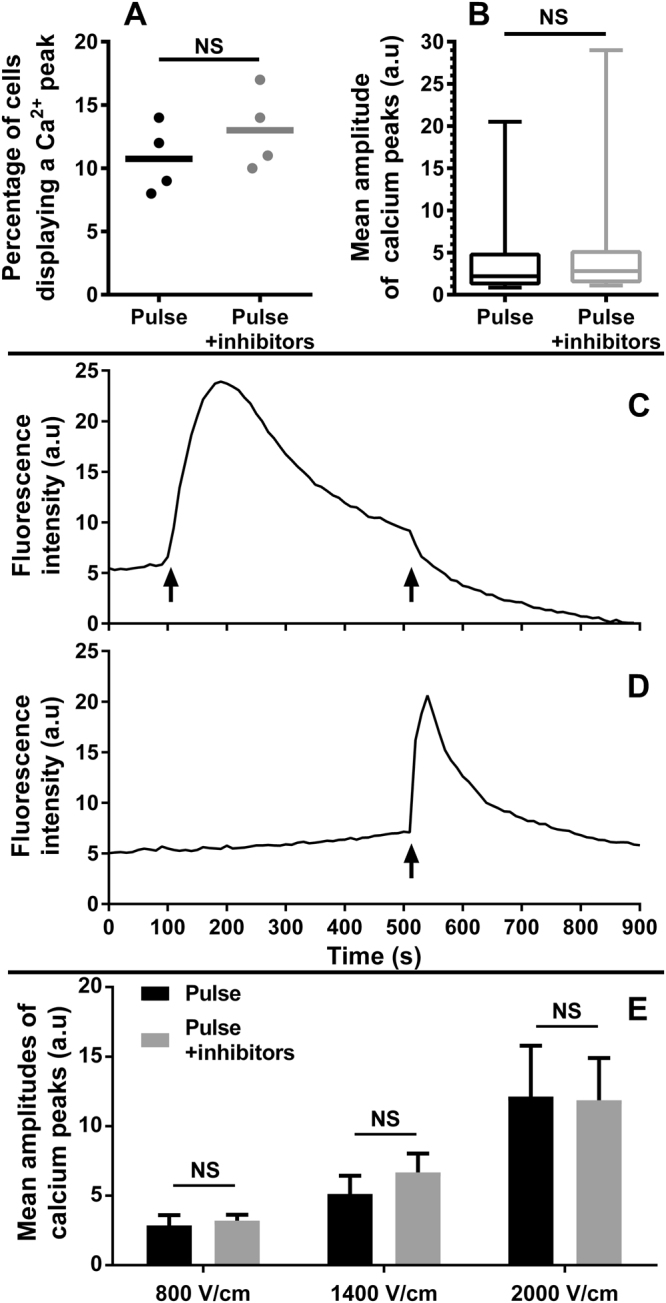
Figure 4.

Origin of the calcium peaks. Cells were incubated with 10 μM of Fluo-4 AM and exposed to various inhibitors. (A,B) Response of haMSC in DMEM in the presence of VOCCs inhibitors. (A) percentage of cells presenting a Ca2+ peak (n = 4 independent experiments), the line represents the mean, p = 0.4 (Mann-Whitney test). (B) Mean amplitude of Ca2+ peaks (4 independent experiments with 39 cells for “Pulse” and 49 cells for “Pulse + inhibitors”), whiskers indicate 5th to 95th percentile range, p = 0.828 (Mann-Whitney test). Cells were exposed to one pulse of 150 V/cm (100 µs), in the presence or absence of 10 µM verapamil and 5 µM mibefradil. (C,D) Response of haMSC in SMEM-EGTA with or without thapsigargin addition. Arrow at 100 s: addition of 2 µM thapsigargin. arrows at 500 s: electric pulse of 2000 V/cm. The background fluctuations were corrected by subtracting the fluorescence of an area without cells for every time point. Graphs are representative of 3 independent experiments (E) haMSC electropulsed in a medium without calcium (SMEM-EGTA) mean amplitude of the calcium peaks in the presence or the absence of 50 µM of 2-APB, 50 µM of Dantrolene and 25 µM of Flecainide. Data are mean ± SD (n = 3 independent experiments). No significant effect of the inhibitors was observed (two-way ANOVA followed by Tukey multiple comparisons test).
