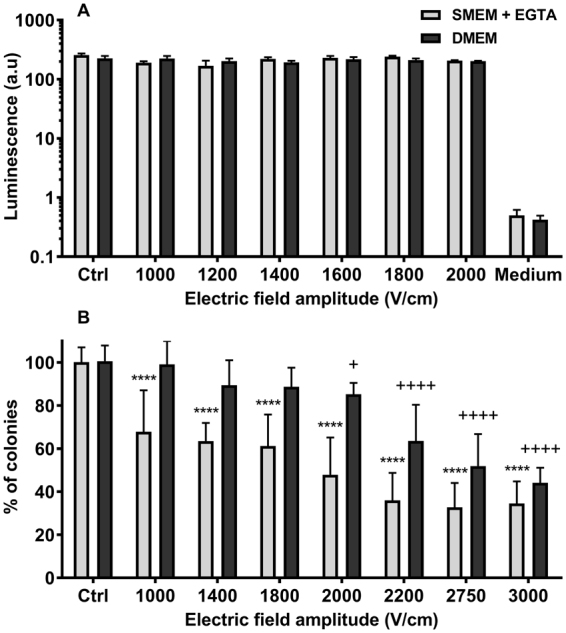
Figure 6.

Cells viability after exposure to one 100 μs pulse in a medium with calcium (DMEM) or without calcium (SMEM-EGTA). (A) haMSC (n = 3 independent experiments). (B) DC-3F cells (n = 3 to 5 independent experiments in triplicates). Data are means ± SD. Statistical significance represented: p < 0.0001 (++++ and ****), p < 0.05 (+) are for comparison respectively to the DMEM and SMEM-EGTA controls (Ctrl) (two-way ANOVA followed by Dunnett’s multiple comparison test).
