Fig. 5.
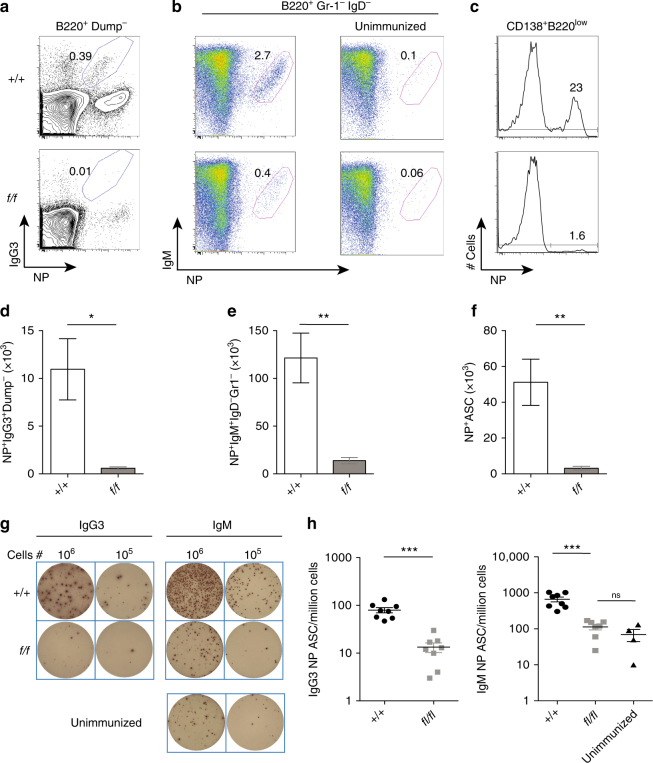
PRMT1 is critical for a TI immune response. Control (+/+) and Prmt1 f/f CD23Cre (f/f) mice were injected i.p. with NP-Ficoll and analysed after 5 days. Splenic NP-specific a IgG3+ and b IgM+ B cells are shown in representative flow cytometry plots along with an unimmunized mouse for IgM in (upper) control (+/+) and (lower) Prmt1 f/f CD23Cre (f/f) mice. c Histograms display the proportion of spleen ASC (CD138+B220low) that were NP-specific at day 5 post immunization in (upper) control (+/+) or (lower) Prmt1 f/f CD23Cre (f/f) mice. a–c Numbers represent the frequency of events within the indicated regions. d–f Numbers of splenic NP-specific IgG3+ B cells d, NP-specific IgM+ B cells e and NP-specific ASC f are shown. Representative wells g and frequency h of NP-specific IgG3+ and IgM+ ASC as measured by ELIspot in the spleen and presented as ASC per million spleen cells. Naive IgM ELISpot sample g is from control (+/+) mice. *P ≤ 0.05; **P ≤ 0.01; ***P ≤ 0.001; ns = not significant (unpaired t-test). Data are representative of two independent experiments with four mice per group. Mean and s.e.m. in d–f and h. Flow cytometry gating strategies for this figure are shown in Supplementary Fig. 9

