Figure 1.
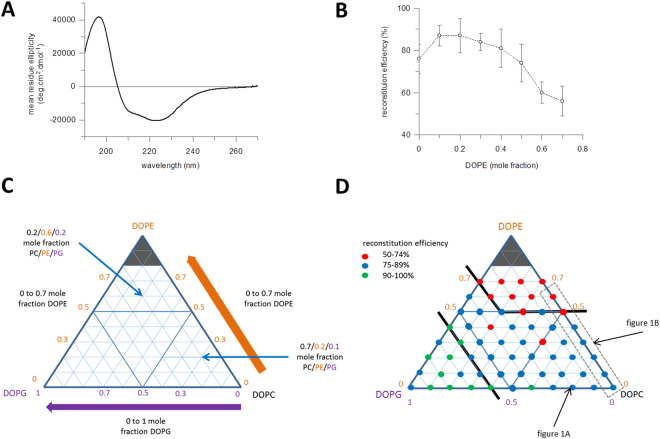
Reconstitution of LacY in lipid vesicles with different lipid compositions. (A) Synchrotron CD spectrum of LacY reconstituted into 0.8/0.2 DOPC/DOPG (mole fraction). (B) Reconstitution of LacY in vesicles composed of DOPC and DOPE mixtures (n = 5, error bars are ±SD). The concentration of reconstituted protein in each sample was measured by Markwell-Lowry assay, from this the reconstitution efficiency was calculated as a percentage of total protein originally added. DOPE concentration given as mole fraction in DOPE/DOPC vesicles. Increasing concentration of non-lamellar lipids results in decreasing reconstitution efficiency. (C) Diagrammatic representation of the tertiary lipid mixes used throughout the study. Axes represent mole fraction of the three lipids. Using DOPC as the base lipid, the axis along the base of the triangle increases right to left from 0 to 1 mole fraction of DOPG (purple). The two other triangle axes increase from 0 to 0.7 mole fraction DOPE (orange, from either DOPG only or DOPC only, with the latter right hand triangle edge representing the DOPC/DOPE compositions in Fig. 1B). Thus the edges of the triangle are two component mixtures, for example of DOPC and DOPG along the baseline axis. Compositions within the triangle are all tertiary mixtures. Two example tertiary mixes – 0.2/0.6/0.2 PC/PE/PG and 0.7/0.2/0.1 PC/PE/PG are highlighted. (D) Diagrammatic representation of the reconstitution of LacY in vesicles composed of DOPC, DOPE and DOPG mixtures. Coloured dots show the reconstitution efficiency at different lipid compositions; red dots indicate the lowest efficiency with 50–74% of the protein being successfully reconstituted, blue dots indicate efficiencies of 75–89% and green dots the highest reconstitution efficiencies of 90–100%. The lipid compositions corresponding to the individual spectrum in 1 A and binary mixtures in 1B have been indicated with arrows and a dashed box. The solid black lines are added as a guide to identify the lipid composition regions that gives rise to the differing efficiency regimes. LacY reconstitutes efficiently in most bilayer conditions. High concentrations of DOPE and DOPG inhibit and enhance reconstitution efficiency respectively.

