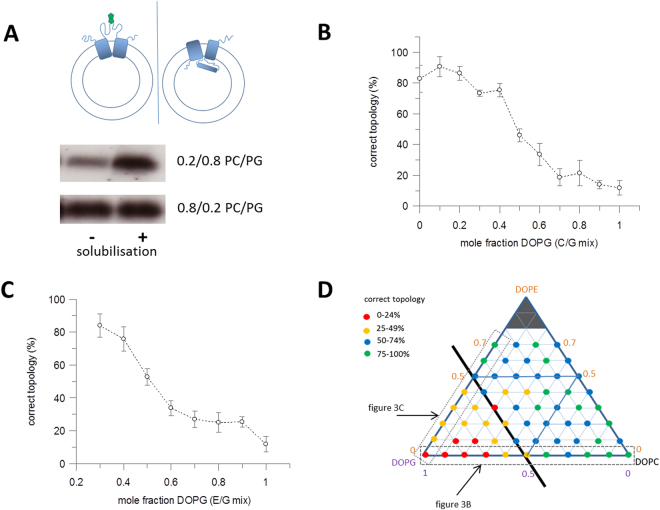
Figure 3.
LacY topology changes in lipid vesicles with different lipid composition. (A) LacY with a single-cysteine (S146C) in the long interdomain loop was reconstituted into lipid vesicles. Schematic shows the 2 LacY domains in blue, with the correct topology on the left (biotin label attached to S164C shown in green) and inverted N domain topology with no labelling on the right. The amount of biotin labelling of S146C was compared before and after solubilisation of the vesicles by OG detergent. Equal amounts of labelling indicated correct topology. Increasing amounts of an incorrect topology present resulted in a decrease in the extent of labelling prior to OG solubilisation. Labelling was quantified from SDS-PAGE gels, as shown, with fluorescent avidin or using a fluorescence-based biotinylation assay. The two lanes labelled “−“ and “+” indicate before and after solubilisation of vesicles by OG. (B) Dependence of correct topology of reconstituted LacY on DOPC/DOPG composition (n = 5, error bars ± SD). DOPG concentration is given as mole fraction in DOPC/DOPG vesicles. (C) Correct topology of LacY reconstituted into bilayers composed of DOPE and DOPG (n = 5, ±SD). (D) Diagrammatic representation of the structural changes in different lipid compositions. Red dots represent the lowest percentage of protein in the correct topology, from 0–24%, yellow dots from 25–49%, blue dots from 50–74% and green dots the highest percentage, from 75–100%. Grey dashed and dotted boxes highlight the two component lipid mixes shown in Fig. 3B,C respectively. Bilayers with high percentages of DOPG show an increase in inverted topology.

