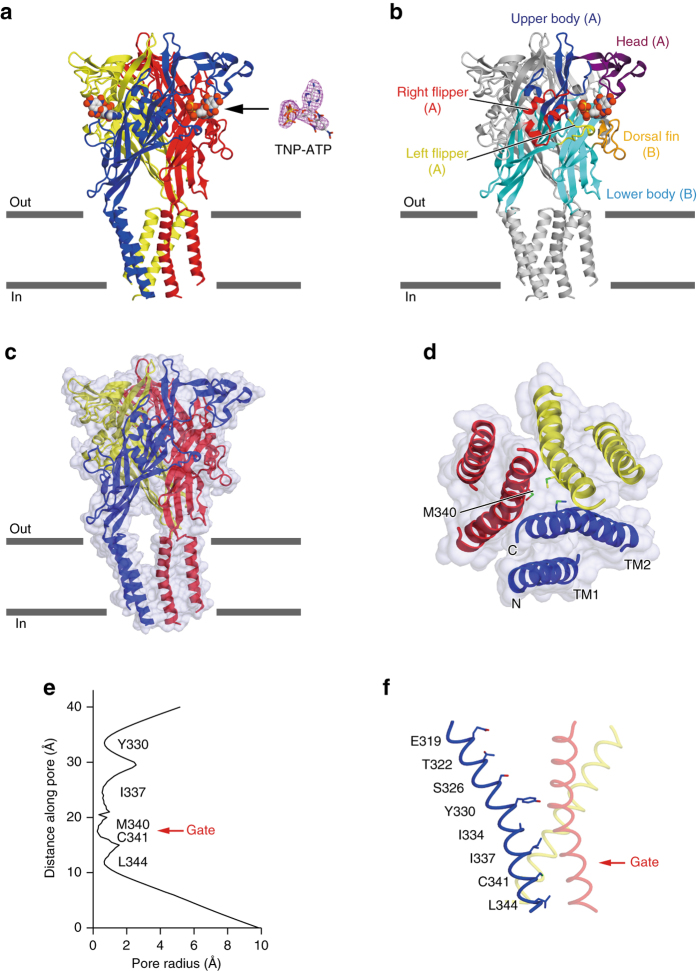
Fig. 2.
The architectures of the TNP-ATP-bound ckP2X7 structure. a The TNP-ATP-bound ckP2X7 structure, viewed parallel to the cell membrane. The blue, red, and yellow colors correspond to each subunit. The omit F o–F c density map contoured at 2.5 σ is presented for the TNP-ATP molecular density. b The recognition manner of TNP-ATP. The molecule is colored according to the dolphin-like model20. c The surface model with a cartoon representation of the TNP-ATP-bound ckP2X7 structure. d The surface model with a cartoon representation of the transmembrane domain in the TNP-ATP-bound ckP2X7 structure, viewed from the intracellular side. Amino-acid residues involved in the pore constriction region are depicted by stick models. e The pore radius for the TNP-ATP-bound ckP2X7 structure along the pore center axis. The pore size was calculated with the program HOLE. f Pore-lining residues of the TNP-ATP-bound ckP2X7 structure are shown in stick representations

