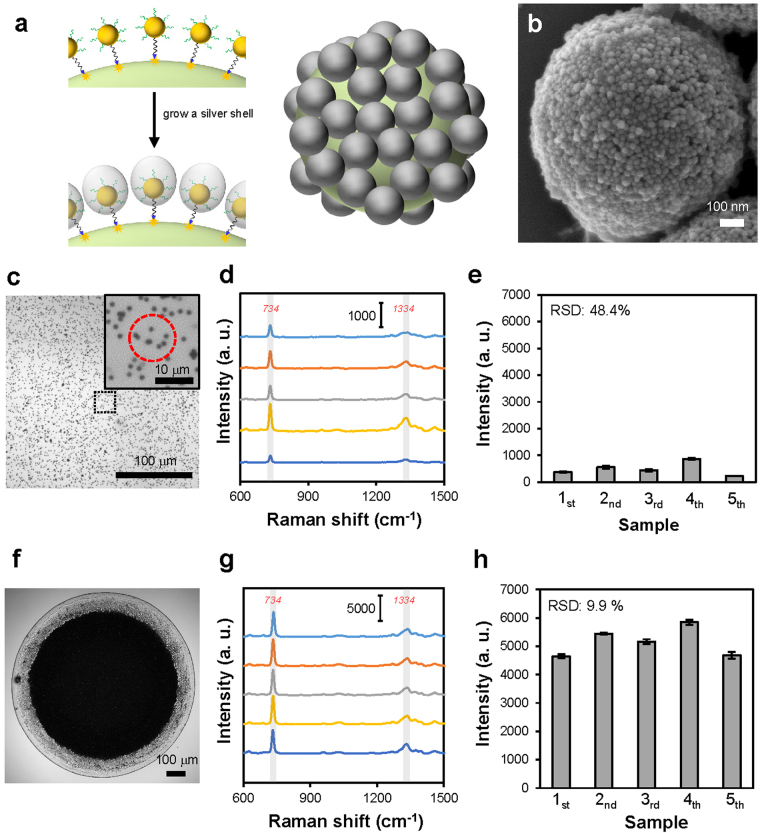
Figure 3.
Addition of a Ag shell to the core-satellite nanostructure and utilization of the nanostructure in SERS measurements. (a) Schematic representation of the growth of a Ag shell on the AuNPs immobilized on the polymer beads. (b) Representative SEM image of the core-satellite nanostructure coated with a Ag shell. (c,f) Representative optical microscope images showing the core-satellite nanostructures (c) dispersed in solution and (f) accumulated by drying a nanostructure-containing droplet suspended on a PDMS sheet. When using substrates similar to that shown in (f) for SERS measurement, the Raman laser was focused at the central regions of the substrates. Inset in (c) is a zoom-in view of the dispersed nanostructures. The red dashed circle indicates the size of the laser spot. (d,g) SERS spectra of 100 μM adenine measured using (d) five mixtures containing the same batch of dispersed nanostructures and (g) five substrates similar to that shown in (f). (e) The intensities of the Raman peak of adenine at 734 cm−1 in the spectra shown in (d). (n = 10 per sample). Error bars, SD. (h) The intensities of the Raman peak of adenine at 734 cm−1 in the spectra shown in (g) (n = 10 per sample). Error bars, SD.

