Figure 6.
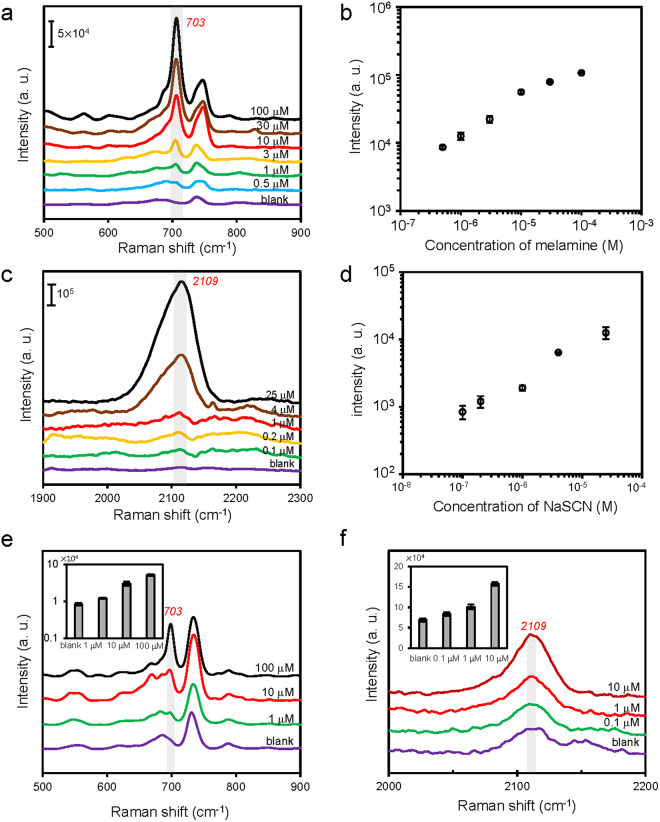
SERS detection of melamine and NaSCN using the synthesized core-satellite nanostructures. (a) SERS spectra of melamine in water with concentrations ranging from 0.5 μM to 100 μM. (b) A plot of the intensity of the Raman peak at 703 cm−1 versus melamine concentration (n = 10 per concentration). Error bars, SD. (c) SERS spectra of NaSCN in water with concentrations ranging from 0.1 μM to 25 μM. (d) A plot of the intensity of the Raman peak at 2109 cm−1 versus NaSCN concentration (n = 10 per concentration). Error bars, SD. (e) SERS spectra of milk samples spiked with different concentrations of melamine (blank, 1 μM, 10 μM, and 100 μM). The inset in (e) shows the intensities of the Raman peak at 703 cm−1 versus melamine concentration (n = 10 per concentration). Error bars, SD. (f) SERS spectra of milk samples spiked with different concentrations of NaSCN (blank, 0.1 μM, 1 μM, and 10 μM). The inset in (f) shows the intensities of the Raman peak at 2109 cm−1 versus NaSCN concentration (n = 10 per concentration). Error bars, SD.

