Figure 1.
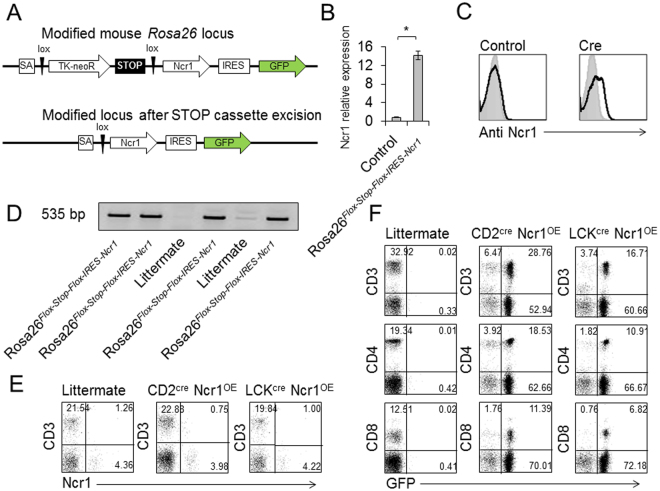
Generation of Rosa26Flox-Stop-Flox-IRES-Ncr1 mouse and crossing with CD2cre and LCKcre mice. (A) Schematic representation of the Rosa locus-targeting vector. (B) Clones of ES cells were tested for Ncr1 mRNA expression following cre recombinase treatment. Ncr1 relative expression, compared to control ES cells is presented. The experiment combines data from three independent experiments. Values are shown as mean ± SEM. *P < 0.05. (C) FACS staining of ES cells, untreated, or following cre treatment. Gray histograms represent background control. Black histograms represent specific staining. Each FACS plot is representative of at least three independent experiments. (D) Chimeric mice were crossed to WT C57BL/6 mice and the progeny were genotyped using specific primers. DNA samples run on gel are presented. Specific bands sized 535 bp signify the inserted Ncr1 gene. The figure represents the four founder breeders. Contrasts were adjusted for clarity. (E,F) Rosa26Flox-Stop-Flox-IRES-Ncr1 mice were bred with CD2cre and LCKcre mice. Offspring were denoted CD2cre Ncr1OE and LCKcre Ncr1OE respectively. (E) FACS plots depicting CD3 and Ncr1 expression in the transgenic mice, compared to a littermate. (F) FACS plots depicting CD3, CD4 and CD8, and GFP expression in the transgenic mice, compared to a littermate. The plots are representative of five independent stainings. Percentages are indicated.

