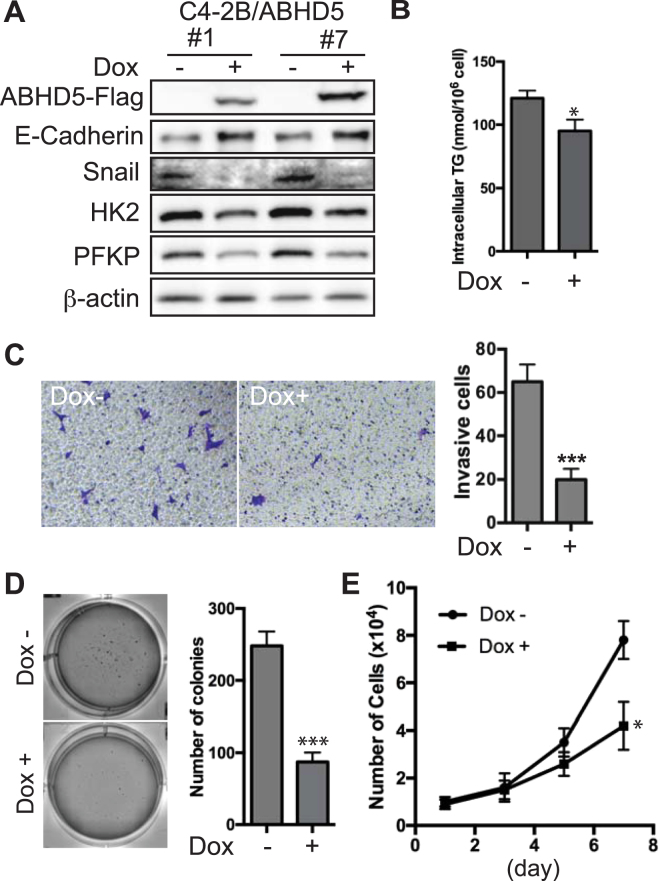
Figure 6.
Effects of ectopic ABHD5 overexpression on the proliferation and invasion of C4-2B cells. (A) Expression level of ABHD5-Flag, E-Cadherin, Snail, HK2, PFKP and β-actin proteins in C4-2B/ABHD5 cells treated with or without doxycycline (dox). (B) Level of intracellular TAG content in C4-2B/ABHD5 cells treated with or without dox. Two-tailed t-test, *P < 0.05. (C) Repression of cell invasion by ABHD5. A representative image of Transwell invasion assay is shown for each group, respectively, on the left. Numbers of invasive cell are plotted on the right. Data are presented as mean ± SEM (n = 3) of experiments performed in triplicate. Two-tailed t-test, ***P < 0.001. (D) Repression of colony formation by ABHD5. A representative image of soft agar assay is shown for each group, respectively, on the left. Number of colonies is plotted on the right. Data are presented as mean ± SEM (n = 3) of experiments performed in triplicate. Two-tailed t-test, ***P < 0.001. (E) Repression of cell proliferation by ABHD5. Growth curve is plotted for C4-2B cells grown in the presence or absence of doxycycline. Data are presented as mean ± SEM (n = 3) of experiments performed in triplicate. Two-way ANOVA test, *P < 0.05.

