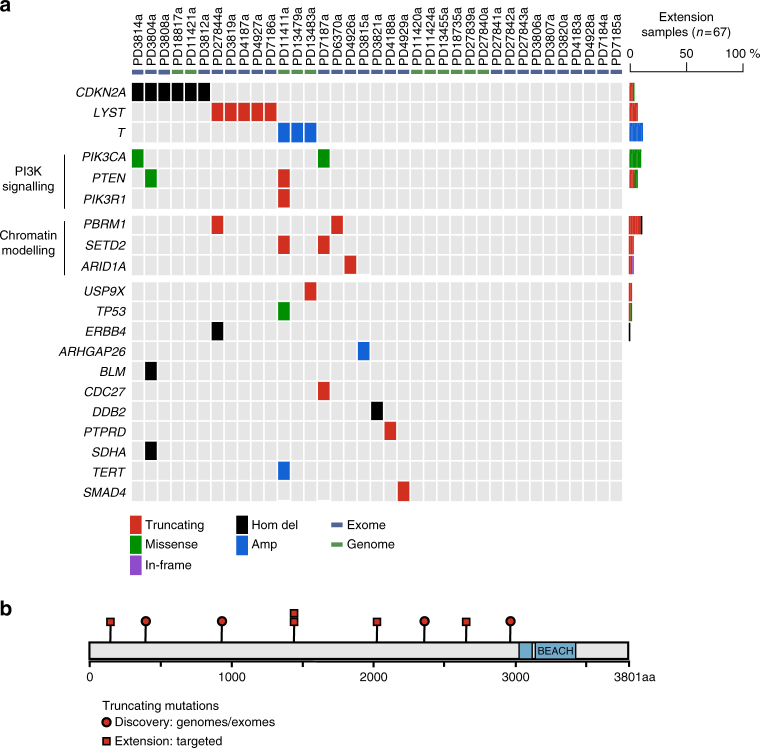
Fig. 1.
Driver landscape of 104 chordomas. a For the discovery cohort, in every tumour (column), driver events are indicated by gene (row) and type of mutation (colour coded; refer to legend). For extension cases, the overall prevalence of driver events in each gene is indicated (colour coded by mutation class). b The LYST protein is depicted, indicating the position of truncating mutations in the discovery (red circles) and extension (red squares) samples. Functional domains are indicated in blue

