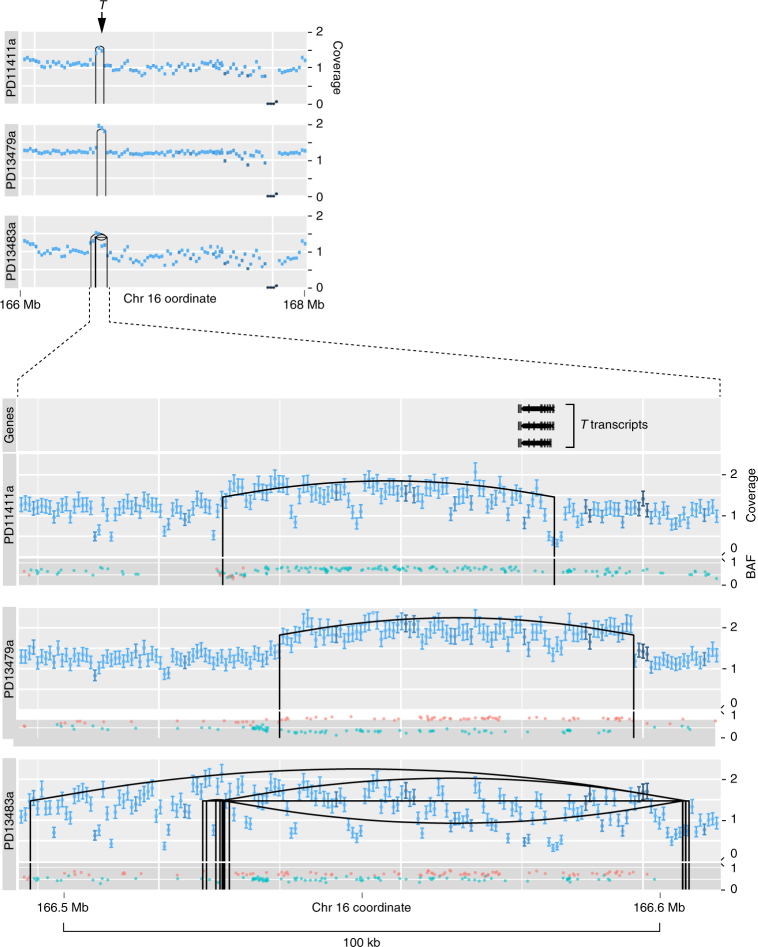
Fig. 2.
T duplications in 11 chordoma genomes. Coverage tracks: for each tumour, the coverage of the T locus is shown over a 2 Mb window (upper panel) and a 100 kb window (lower panel). X axis: genomic position. Y axis: coverage (unit: number of 5′ ends of fragments in a bin/(length of bin × reads for sample) × 3 × 10⁹). The error bars show the 95% confidence interval for the true mean coverage in each coverage bin. The colour coding of the error bars expresses the average mapping score in each bin (light = high; dark = low mapping score). Rearrangements are displayed as vertical black lines at the breakpoints connected by an upward arc for tandem duplications, a downward arc for deletions, and a straight line for inversions. BAF (B-allele frequency) track: the BAF tracks show the allele frequencies of heterozygous SNPs. Allele frequencies were plotted in a colour corresponding to their inferred parental chromosome, as determined by comparison to imputed haplotype blocks provided by the 1000 genomes project. X axis: genomic position. Y axis: B-allele frequency

