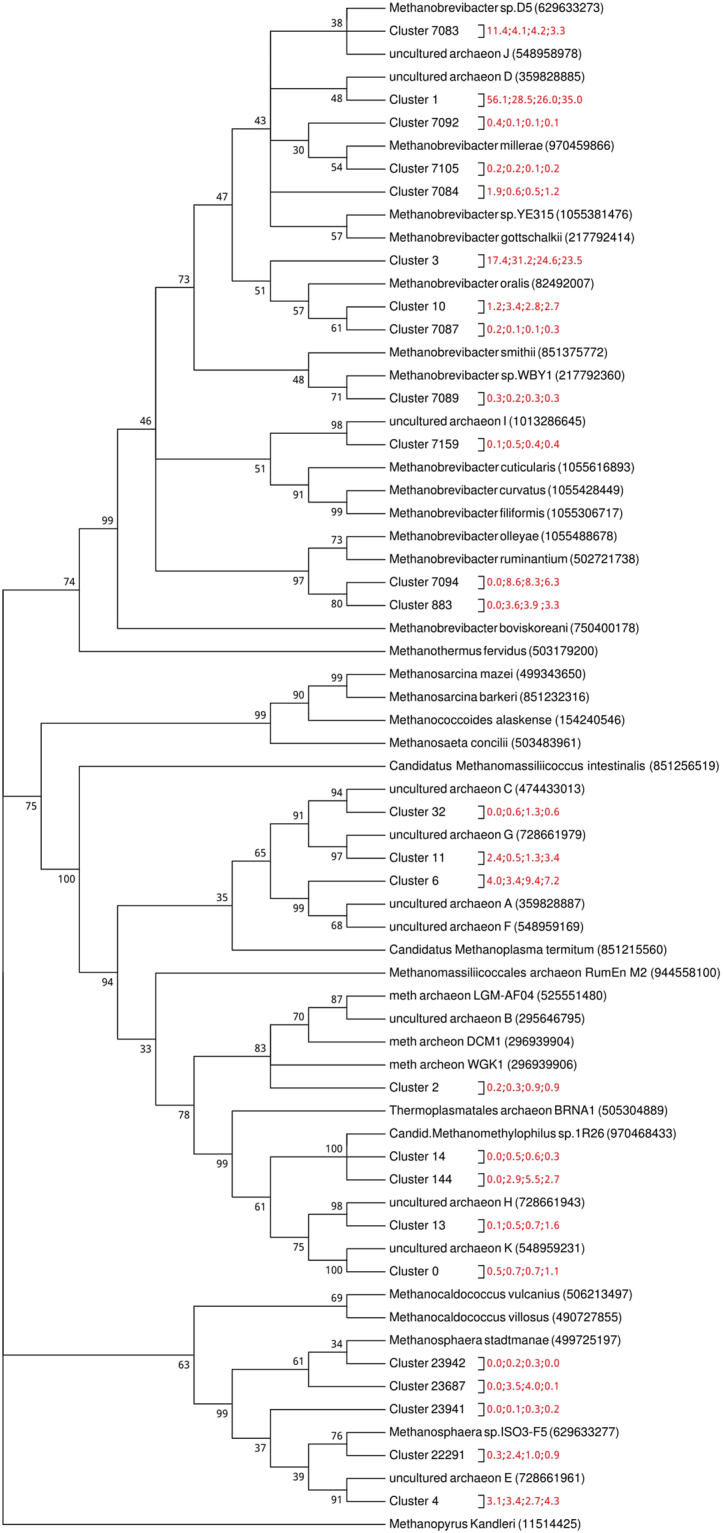
Figure 1.

The evolutionary history which approximately identifies the phylogeny of clustered sequences was inferred using the Maximum Parsimony method. The percentage of replicate trees in which the associated taxa clustered together in the bootstrap test (500 replicates) are shown next to the branches. Branches with less than 30% support were collapsed. The MP tree was obtained using the Subtree-Pruning-Regrafting (SPR) algorithm with search level 1 in which the initial trees were obtained by the random addition of sequences (10 replicates). All positions with less than 85% site coverage were eliminated. There were a total of 157 positions in the final dataset. The 4 numbers in red separated by a “;” after each cluster represent the average representation of this cluster in R, A, RA and AA groups respectively.
