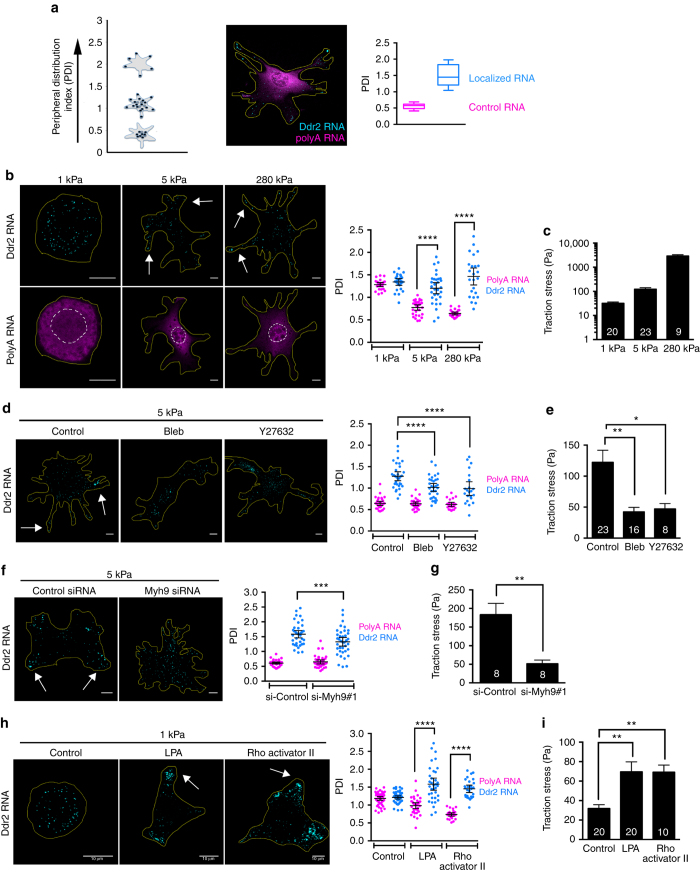
Fig. 3.
Increased substrate stiffness and actomyosin contractility enhance APC-dependent RNA localization. a Left panel: schematic depicting changes in PDI index values for the indicated hypothetical RNA distributions. Higher PDI values reflect more peripheral RNA distributions. Middle panel: in situ hybridization of Ddr2 RNA (localized, cyan) and polyA RNA (control, magenta) in a representative cell on glass. Right panel: corresponding PDI values from a population of cells. Note that, in order to compare cytoplasmic distributions, signals within the nuclear area are subtracted prior to calculation of PDI values. This creates an apparent increase in PDI, which is disproportionately observed on 1kPa substrates (e.g., in panels b, h), because of the larger relative area covered by the nucleus. b Representative Ddr2 and polyA RNA distributions on substrates of varying stiffness, and corresponding PDI values. Arrows point to peripheral Ddr2 RNAs. c Traction force microscopy analysis on substrates of the indicated stiffness. d Representative Ddr2 RNA distributions and PDI values of cells treated with blebbistatin (Bleb) or Y27632, plated on 5 kPa substrates. e Traction force microscopy analysis of cells treated as in d. f Representative Ddr2 RNA distributions and PDI values of control cells or cells knocked-down for Myosin heavy chain IIA, Myh9, plated on 5kPa substrates. g Traction force microscopy analysis of cells treated as in f. h Representative Ddr2 RNA distributions and PDI values of control cells or cells treated with LPA or Rho activator II, plated on 1 kPa substrates. i Traction force microscopy analysis of cells treated as in h. For all PDI quantifications, bars represent the mean with 95% confidence interval. Points indicate individual cells analyzed in at least two or more independent experiments. For all traction force analyses, error bars represent standard error and n-values are indicated within each bar. p-values: ****<0.0001, ***<0.001, **<0.01, *<0.05 by analysis of variance (b–f, h, i) or Mann–Whitney test (g). Scale bars: 10 μm. Yellow lines: cell outline; white dashed line: nuclear outline

