
Figure 1. Time course of the effects of glutamatergic MnPO neuron stimulation.
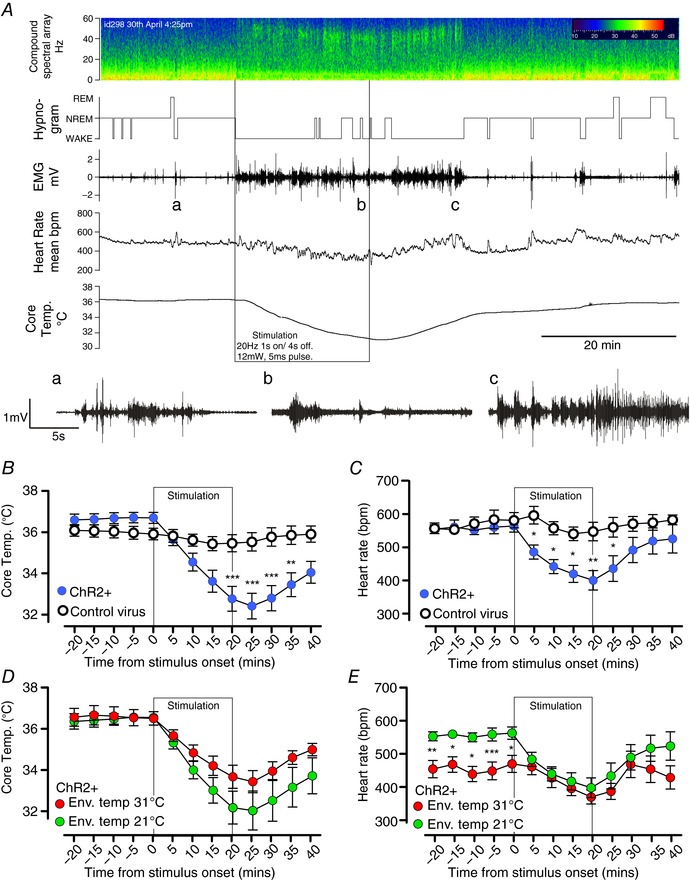
A, experimental recording of changes in EEG compound spectral activity, wake–sleep state (hypnogram), neck muscle activity (EMG), heart rate (HR) and core temperature (T c) in response to 20 min of phasic optogenetic stimulation of MnPO glutamatergic neurons (mouse id 298). Note that the animal awakens almost immediately with onset of stimulation, but that HR and T c gradually fall throughout the stimulation period. Insets a–c: expanded EMG trace before, during and after stimulation; note the rhythmic bursts in EMG representing shivering in c. B and C, grouped data of T c (B) and HR (C) changes during stimulation of VGlut2‐ires‐CreChR2+ mice (n = 14) with a hypothermic response and controls (n = 7). D and E, grouped data of T c (D) and heart rate (E) changes during stimulation in the light phase in VGlut2‐ires‐CreChR2+ (n = 7) with a hypothermic response in room temperature conditions (nominally 21°C) and thermoneutral (nominally 31°C) conditions. *** P < 0.001, ** P < 0.01, ** P < 0.05, t test with Bonferroni correction.