
Figure 2. Stimulation causes heat loss through rapid vasodilatation of the tail.
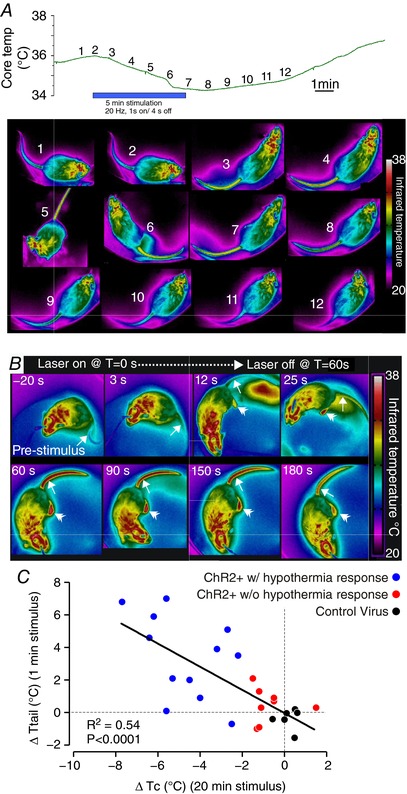
A, time course of changes in T c (upper panel) and tail temperature (T tail, lower panel, one photo each minute at the time shown on the upper panel) during 5 min of phasic stimulation. Note that increasing T tail (arrow) precedes a decrease in T c following the beginning of the stimulus, and T tail decreases before T c recovers post‐stimulus. B, example thermographs used for analysis of T tail (single arrowhead) during a 60 s stimulus starting at T = 0. Note that temperature of the feet (double arrowhead) also increases during stimulation. C, x–y plot of ΔT c vs. ΔT tail in 20 VGluT2‐ires‐CreChR2+ and 6 mice injected with a control virus.