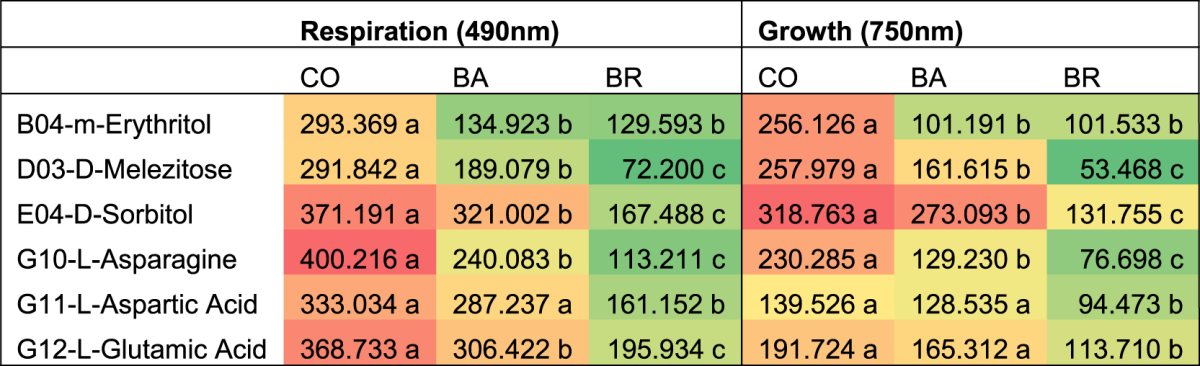
Table 1.
Area under the curve (AUC) of respiration and growth (means of 6 replicates). Summary of one-sided test hypothesis: CO metabolism larger than BA or BR, simultaneous tests for general linear hypotheses. See Supplementary Tables S1 and S2 for full set of statistic data. Different letters indicate significant differences between inoculums. The colour gradient is used in the table to graphically represent the degree of overall use of substrate (green = low degree, red = high degree).