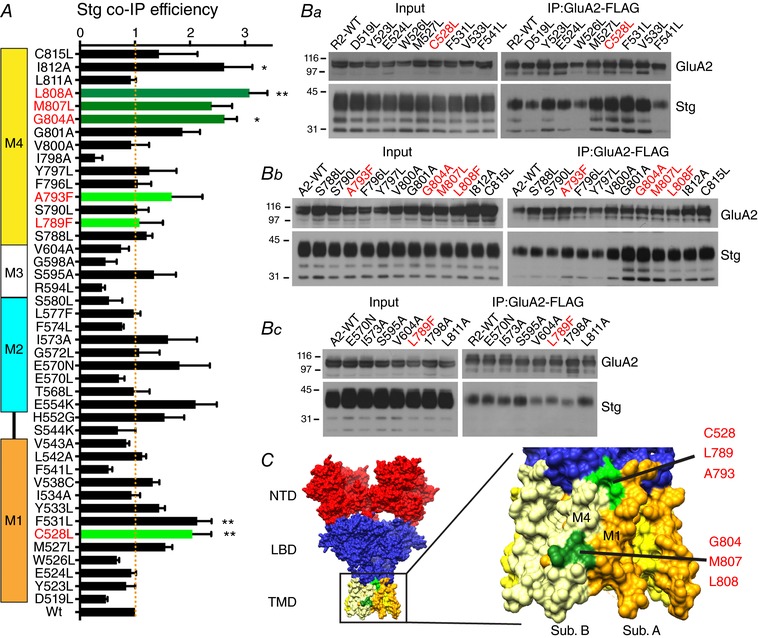
Figure 5. Binding efficiency of Stg to GluA2 TMD point mutants.

A, co‐IP efficiency of Stg upon IP of GluA2iR WT and mutants. Efficiency is calculated by dividing co‐IP signal by input signal by IP signal and normalized to the WT efficiency. M1–4 indicate the locations of TMD helices. Statistical significance was determined by one‐way ANOVA with post hoc Dunnett's comparison test against the GluA2wt (* P < 0.05; ** P < 0.01; n = 3; mean ± SEM). B, representative western blots of input and immunoprecipitate (IP). Stable HEK cell line expressing Stg–1D4 was transfected with plasmids expressing GluA2iR–FLAG WT and mutants. Anti‐FLAG M2 antibody was used for IP. Western blots for GluA2 and Stg were probed with anti‐GluA2CT (αGluA2CT) and anti‐Rho1D4 (αRho1D4), respectively. Molecular mass markers are on the left (kDa). The mutants studied by electrophysiology are in red. C, locations of residues G804, M807 and L808 are at the surface (green) of the TMD in the crystal structure PDB: 4U4G. The C528, L789 and A793 are shown in light green.
