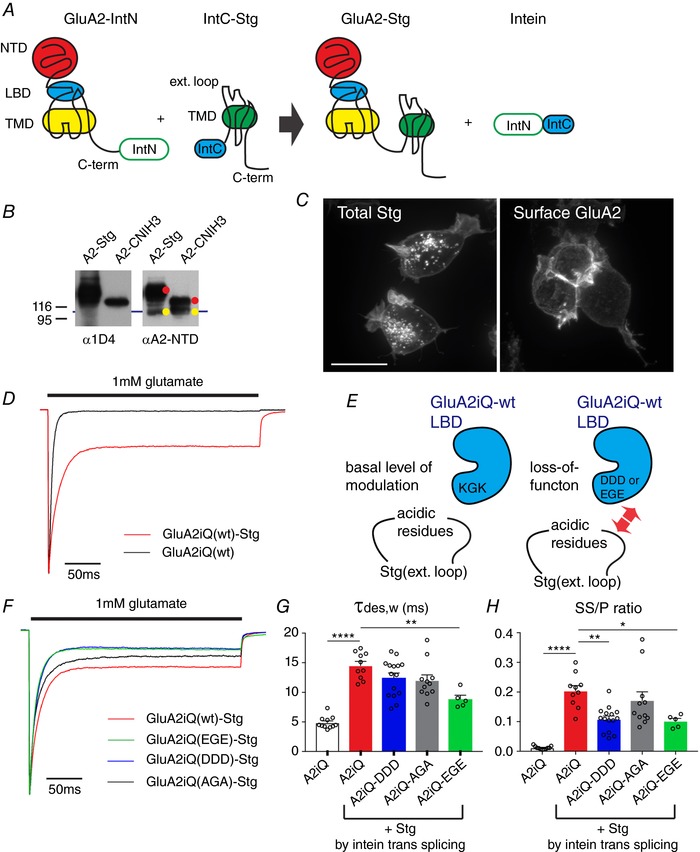
Figure 6. Recording currents from GluA2 and Stg complexes tethered by intein trans‐splicing.

A, schematic diagram of the construct design and intein trans‐splicing reaction. B, western blot of lysates obtained from TetON HEK cells co‐expressing GluA2–IntN and IntC–Stg or IntC–CNIH3. Auxiliary subunits are tagged at the C‐terminus with 1D4 epitope. Yellow indicates unspliced GluA2–IntN and red indicates intein trans‐splicing products that are GluA2 tethered with Stg or CNIH3. C, confocal images of TetON HEK cells expressing GluA2–IntN and IntC–Stg. Left, total staining by anti‐1D4 in order to detect Stg. Right, surface labelling by anti‐GluA2‐NTD. Scale bar 10 μm. D, representative peak‐normalized glutamate‐evoked recording from patches containing GluA2iQ alone (black) or GluA2iQ–IntN+IntC–Stg (Red). E, a schematic model introducing the ‘KGK’ sequence in the D2 lobe of LBD and its role in Stg‐dependent gating modulation of AMPAR. F, representative recordings from Stg+GluA2 mutants with ‘KGK’ sequence replaced by ‘DDD’, ‘EGE’ and ‘AGA’, using intein trans‐splicing tethering scheme. Stg+GluA2iQ wild‐type (wt) is shown as a reference. Peak normalized glutamate‐evoked recording from patches are shown. G and H, summary of τw,des and SS/P amplitude ratios. Statistical significance of each pair indicated by both ends of horizontal bars was determined by one‐way ANOVA with post hoc Tukey's multiple comparison test (* P < 0.05; ** P < 0.01; **** P < 0.0001; mean ± SEM). Individual data points are shown as open circles.
