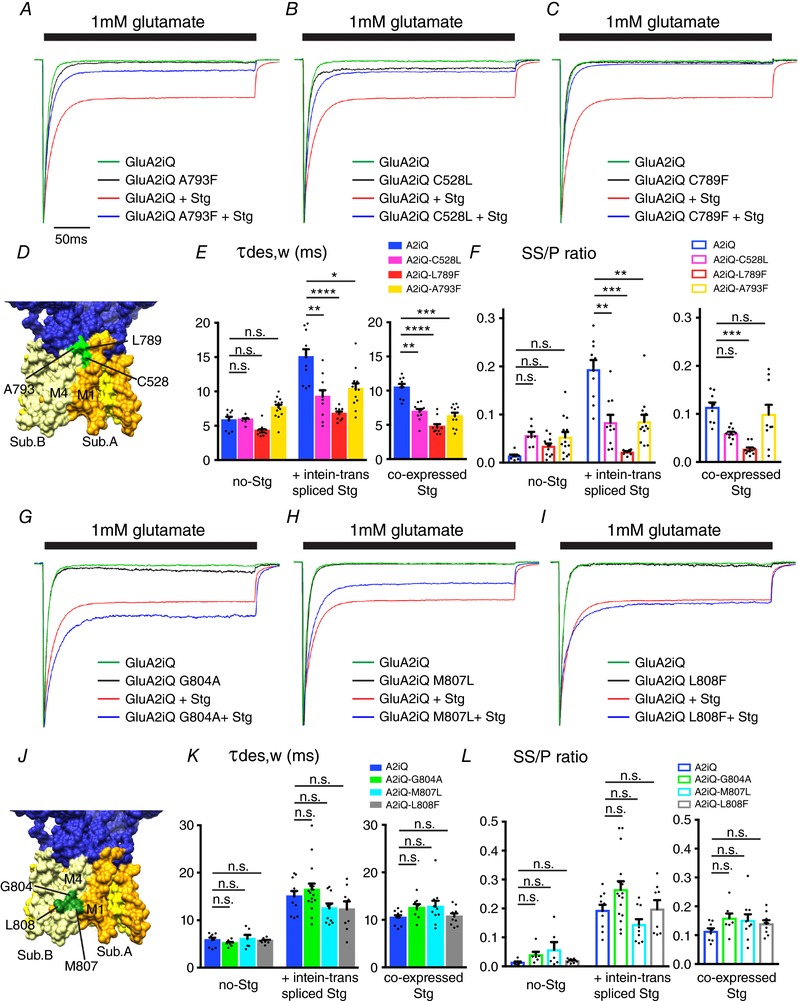
Figure 7. Effects of key residues in M1 and M4 of GluA2 on Stg‐dependent gating modulation.

A–C and G–I, representative recordings obtained from outside‐out patches in response to 1 mm glutamate application for 300 ms. The traces were normalized to the peak amplitudes to facilitate comparison of the gating kinetics. The constructs transfected into TetON HEK cells are indicated. D and J, locations of the mutants studied in this figure (PDB: 4U4G). E, F, K and L, summary of τw,des and SS/P amplitude ratios. GluA2 variants and Stg were tethered by intein trans‐splicing or co‐expressed as non‐tethered individual entities, as indicated. Individual data points are shown as dots. Statistical significance was determined by one‐way ANOVA with post hoc Tukey's test (* P < 0.05; ** P < 0.01; *** P < 0.001; **** P < 0.0001; mean ± SEM) from data sets 3 (inteine trans‐spliced) and 6 (co‐expressed), respectively.
