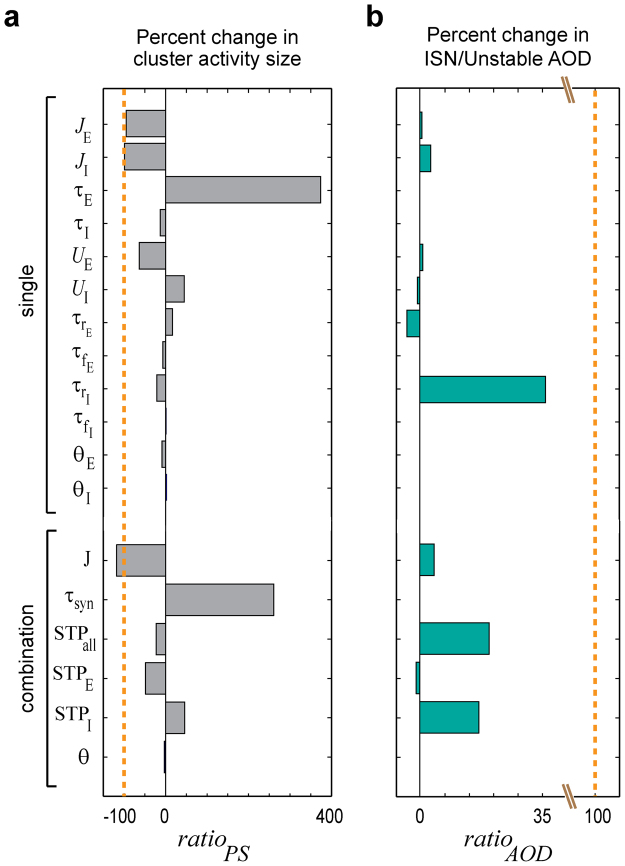
Figure 5.
Impact of specific maturational processes on the sparsification process. We measured the change in network behavior when, virtually, we only mature a single parameter or small sets of similar parameters from P10 to P20. This enables us to indicate key parameters required for sparsification. (a) The plotted values of measure the modification-induced changes in , i.e. the size of simulated cluster activity, relative to the decrease when transitioning from P10 to P20. The dashed orange line at indicates the normal amount of decrease in , as expected when transitioning from P10 to P20. (b) The plotted values of measure the modification-induced change in , i.e. the ratio of areas of ISN and unstable FP-domains, relative to the increase when transitioning from P10 to P20. The dashed orange line at indicates the normal amount of increase in AOD ISN/Unstable, as expected when transitioning from P10 to P20. See Methods for the formulas of and . For computing AOD ISN/Unstable, we considered the E r-I r-plane plots with = [10,10] Hz. Parameters combinations are , , , , , .

