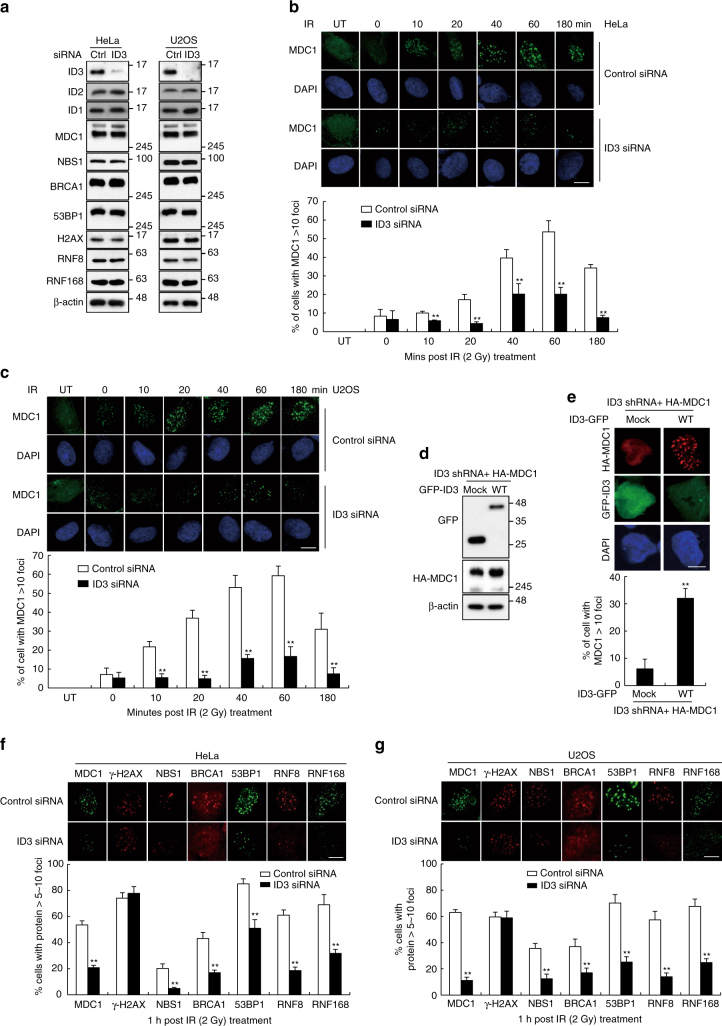
Fig. 4.
ID3 depletion reduces MDC1 foci formation. a HeLa and U2OS cells were transiently transfected with either control siRNA or ID3-specific siRNA. western blotting using antibodies to the indicated proteins shows the expression levels of each. b, c Control or ID3-depleted HeLa (b) and U2OS (c) cells were exposed to 2 Gy of IR and fixed at the indicated time points. Immunostaining experiments were performed using an anti-MDC1 antibody. Nuclei were stained with DAPI. Representative images (upper panel) and quantification (lower panel) of MDC1 foci in control and ID3-depleted cells (n = 3). Scale bars: 10 μm. d, e A stable knockdown of ID3 in HeLa cells co-expressing shRNA-resistant GFP-tagged wild-type (WT) ID3 and HA-MDC1 was generated. Levels of exogenous ID3 and MDC1 were confirmed by immunoblotting using the indicated antibodies (d). Images depict representative nuclei showing MDC1 foci at 1 h after IR treatment (e). Scale bars: 10 μm. The histogram in the lower panel is a quantification of the average number of cells containing MDC1 foci 1 h after exposure to IR (n = 3). f, g Control or ID3-depleted HeLa (f) and U2OS (g) cells were exposed to 2 Gy of IR. Images depict representative nuclei showing MDC1, γ-H2AX, NBS1, BRCA1, 53BP1, RNF8, and RNF168 foci at 1 h after IR treatment. The lower panel shows the number of IR-induced foci in control and ID3-depleted cells (n = 3). Scale bars: 10 μm. Uncropped blots of this Figure accompanied by the location of molecular weight markers are shown in Supplementary Fig. 14. Data are presented as means ± s.d. P values are based on Student’s two-tailed t-test: **P < 0.01

