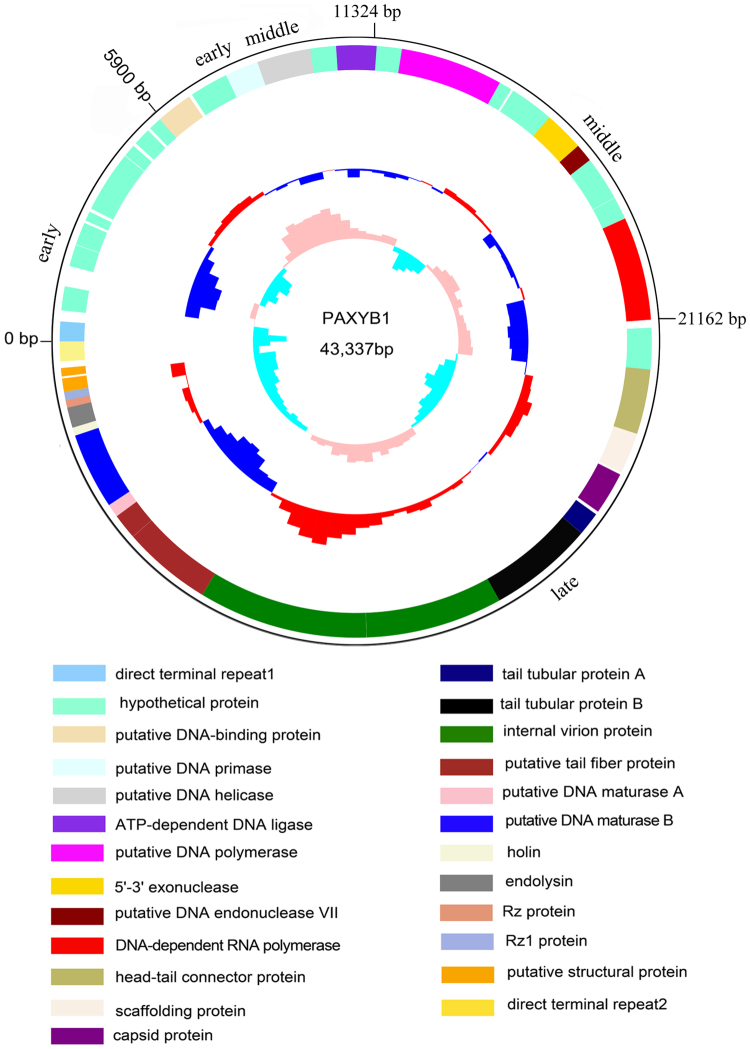
Figure 2.
Genome organization of PAXYB1. The first circles represent the ORFs on the sense strands in PAXYB1. Sixty ORFs are marked with different colours according to their different functions and arranged in early, early middle, middle and late clusters. The DTRs are also indicated. The second circle shows the G/C content. Red outward and blue inward indicate that the G/C content of this region is high and less than the average G/C content of the whole genome, respectively. The third circle shows the GC skew.

